
Structural resemblance to 2000
IT growth doubts tightening
If the V-shaped rebound after the 60th trading day is not resolved
AI industry doubts
If stock prices are undervalued for a long time
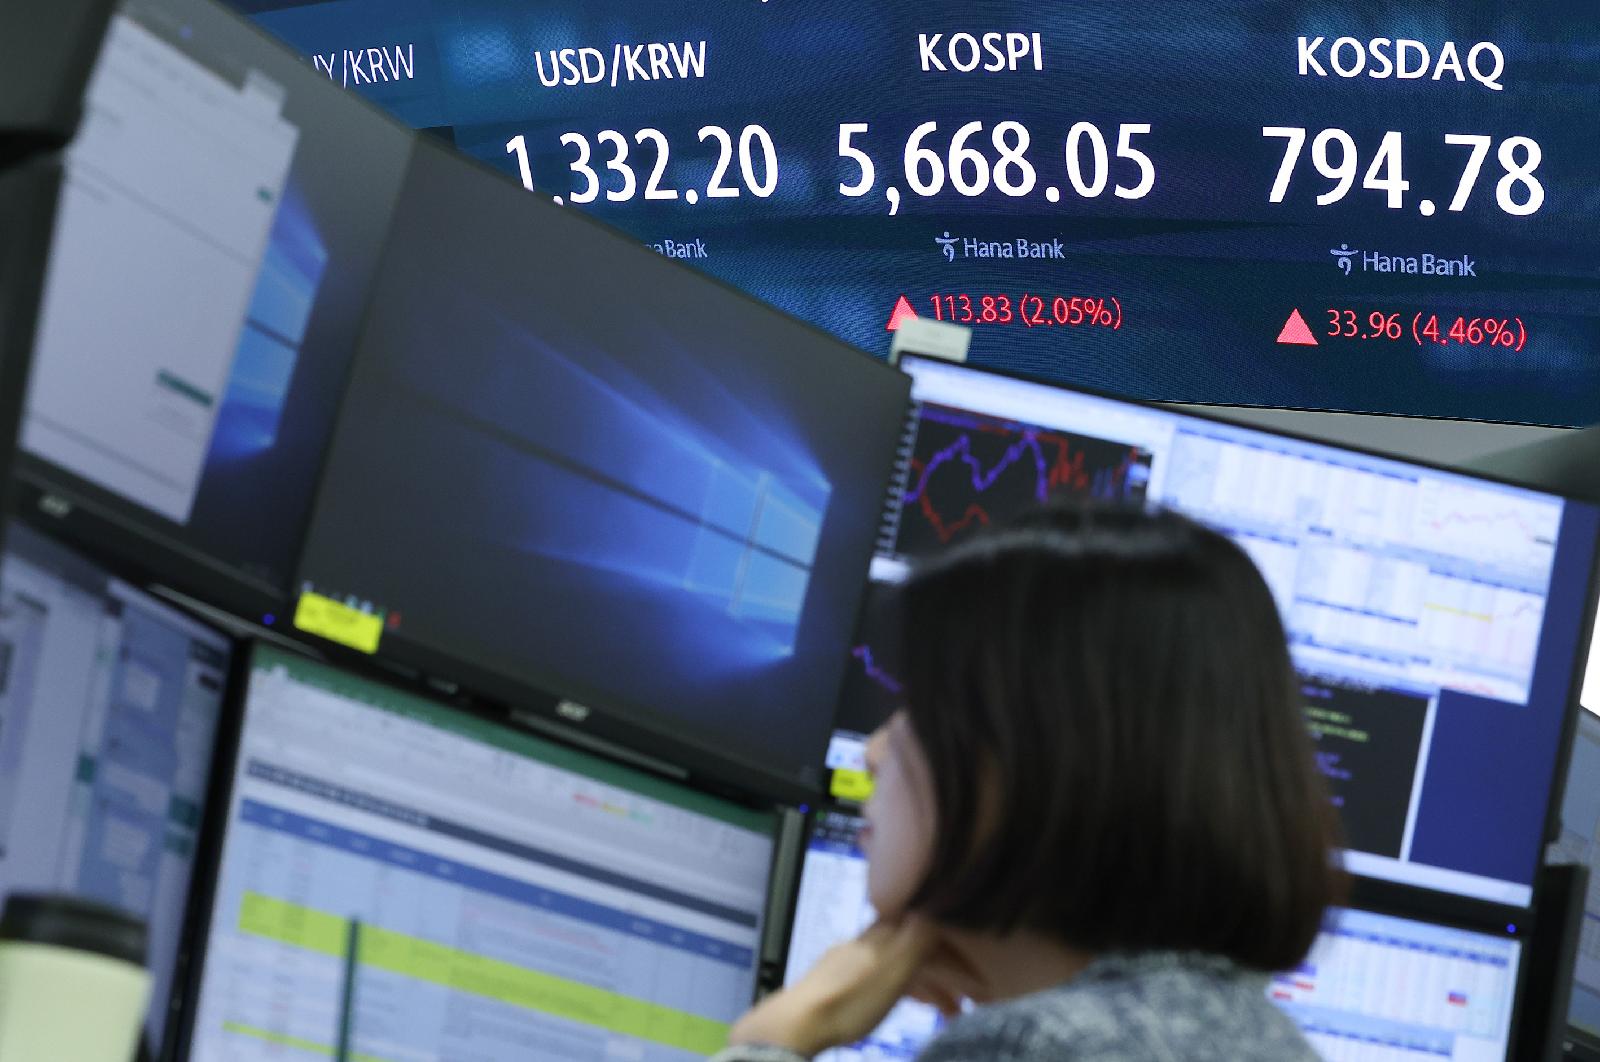
![On the 16th, the closing price of Hana Bank's headquarters in Jung-gu, Seoul, is on the electronic display board of the dealing room. The KOSPI rose 113.83 points (2.05 percent) from the previous day's close to 568.05, and the KOSDAQ closed at 794.78, up 33.96 points (4.46 percent) from the previous day. In the Seoul foreign exchange market, the dollar-won exchange rate fell 13.2 won to 1331.4 won compared to the weekly closing price at 3:30 p.m. the previous day. [News 1]](https://wimg.mk.co.kr/news/cms/202610/19/rcv.NEWS1.NEWS1.20261016.2026-10-16T155418_1008163295_FINANCE-STOCK_I_P1.jpg)
The domestic KOSPI index is falling sharply in a short period of time. Amid the continued high-interest-rate environment, market concerns over credit risks of artificial intelligence (AI) companies have grown, and the domestic stock market, which has a high proportion of semiconductors, is being directly hit. The investment industry is warning that this phase is structurally similar to the dot-com bubble collapse in 2000 rather than during the 2008 financial crisis or the 2020 COVID-19 pandemic. Although the performance forecast is solid, the price-to-earnings ratio (PER), a valuation that was given to future growth, along with rising interest rates, is falling vertically and lowering the index. For this reason, it is advised to prepare for the possibility of a prolonged undervaluation of the domestic stock market as the so-called “de-rating” trend continues.
According to the Korea Exchange on the 18th, the KOSPI continued to decline for seven consecutive trading days from the 6th to the 15th. The index’s fall alone reached 20.7% during the period. Since the 2000s, the KOSPI has fallen for more than six consecutive trading days and has plunged more than 15% on a cumulative basis.
It is a sharp decline due to the dot-com bubble collapse in 2000, the financial crisis in 2008, the European financial crisis in 2011, the COVID-19 pandemic in 2020, and the recent AI credit risk. After 60 trading days, about three months after the consecutive declines, the index mainly rebounded. During the COVID-19 pandemic, the KOSPI rebounded 49.3%, 24.4% during the 2008 financial crisis, and 6.0% during the 2011 U.S. credit rating downgrade. However, at the time of dot-com bubble, the KOSPI fell 4.9% after 60 trading days.
Similar to the dot-com bubble, a fall in PER was preceded by a recent sharp drop in the KOSPI. Looking at the KOSPI’s PER just before this month’s plunge, it fell more than 30% in two months from 17.1 times on Aug. 3 to 11.68 times on Oct. 2. Considering that the KOSPI rose more than 10% during the same period, it is a result of profit growth rather than stock prices.
It is interpreted as the result of lowering PER by significantly increasing earnings per share (EPS), the denominator, as Samsung Electronics and SK Hynix’s second-quarter earnings were reflected. The increase in profit estimates also followed. As the upward speed exceeded the stock price increase rate, the 12-month leading PER (12MF PER) decreased slightly from 5.54 to 5.43 times.
It is analyzed that this pattern is the same as at the time of dot-com bubble in 2000. In the two months immediately before the plunge in 2000, the KOSPI PER plunged 39.0% from 29.65 to 18.10 times. At that time, companies’ profit estimates continued to raise their earnings, maintaining solid performance strength. However, doubts about the long-term profitability and cash generation power of Internet companies have spread, and the multiplexer (PER) has collapsed. It is similar that central banks in major countries have started tightening their currencies by raising their benchmark interest rates. Interest rate hikes dampen liquidity, which usually leads to a pull down of multiplexes.

Kang Jin-hyuk, a researcher at Shinhan Investment & Securities, said, “If the market doubts the sustainability of growth even if profits increase, the recovery of stock prices may be delayed due to a lower valuation,” adding, “If the burden of raising capital leads to a reduction in facility investment (CAPEX) and a lower estimate of semiconductor profits, we should be wary of the possibility of long-term de-rating as in 2000 despite lower valuation.”
On the other hand, the 2008 financial crisis and the 2020 pandemic were recession-type crises that dampened performance forecasts. In addition, valuations soared around the plunge as central banks in major countries responded to concerns about a slowdown in the economy by cutting interest rates and supplying large amounts of liquidity. Despite the rise in profit estimates, it is the opposite of this time, when the preceding multiplex was lowered.
However, not all situations are the same as at the time of dot-com bubble. In particular, this sharp market is characterized by the strong value of the won against the dollar. It is a trend that was difficult to find in major plunge markets in the past.
In the 2000 and 2011 cases, when stock prices were relatively slow to recover in the past, the value of the won, which fell during the International Monetary Fund (IMF) foreign exchange crisis and the financial crisis, continued to recover slowly. However, in both cases, the won’s value has depreciated in the stock market plunge. The depreciation of the won was more pronounced during the plunge in 2008 and 2020 when the stock price rebound was seen. On the other hand, the value of the won continued to strengthen in this sharp market without falling.
The plunge is interpreted as a result of the U.S. currency tightening, coupled with the entry point of the dollar’s weakness. In addition, the fact that Korea’s fundamentals are growing compared to the past is also a major difference in net foreign assets and all-time current account surplus.