
Get instant alerts when news breaks on your stocks. Claim your 1-week free trial to StreetInsider Premium here.
Table of Contents
UNITED STATES
SECURITIES AND EXCHANGE COMMISSION
WASHINGTON, D.C. 20549
FORM N-CSR
CERTIFIED
SHAREHOLDER REPORT OF REGISTERED
MANAGEMENT INVESTMENT COMPANIES
Investment Company Act file number: 811-21034
SANFORD C. BERNSTEIN FUND II, INC.
(Exact name of registrant as specified in charter)
1345 Avenue
of the Americas, New York, New York 10105
(Address of principal executive offices) (Zip code)
Joseph J. Mantineo
AllianceBernstein L.P.
1345 Avenue of the Americas
New York, New York 10105
(Name and address of agent for service)
Registrants telephone number, including area code: (800) 221-5672
Date of fiscal year end: September 30, 2022
Date of reporting period: September 30, 2022
Table of Contents
ITEM 1. REPORTS TO STOCKHOLDERS.
Table of Contents
SANFORD C. BERNSTEIN FUND II, INC.
INTERMEDIATE DURATION INSTITUTIONAL PORTFOLIO
ANNUAL REPORT
SEPTEMBER 30, 2022
Table of Contents
Before investing in the Sanford C. Bernstein Fund II, Inc., a prospective investor should consider
carefully the portfolios investment objectives and policies, charges, expenses and risks. These and other matters of importance to prospective investors are contained in the portfolios prospectus, an additional copy of which may be
obtained by visiting our website at www.Bernstein.com and clicking on Investments, found in the footer, then Mutual Fund InformationProspectuses, SAIs and Shareholder Reports or by calling your financial advisor or by
calling Bernsteins mutual fund shareholder help line at 212.756.4097. Please read the prospectus carefully before investing.
For performance
information current to the most recent month-end, please visit our website at www.Bernstein.com and click on Investments, found in the footer, then Mutual Fund InformationMutual Fund Performance at a Glance.
This shareholder report must be preceded or accompanied by the Sanford C. Bernstein Fund II, Inc. prospectus for individuals who are not shareholders of
the Fund.
You may obtain a description of the Funds proxy voting policies and procedures, and information regarding how the Fund voted proxies
relating to portfolio securities during the most recent 12-month period ended June 30, without charge. Simply visit www.AllianceBernstein.com, or go to the Securities and Exchange Commissions
website at www.sec.gov, or call AllianceBernstein at 800.227.4618.
The Fund will file its complete schedule of portfolio holdings with the Commission
for the first and third quarters of each fiscal year as an exhibit to its reports on Form N-PORT. The Funds Form N-PORT reports are available on the Commissions website at www.sec.gov.
Investment Products
Offered: · Are Not FDIC Insured · May Lose Value · Are Not Bank Guaranteed
Table of Contents
Portfolio Manager Commentary (Unaudited)
To Our ShareholdersNovember 15, 2022
On the following pages, you will find the 2022 annual report for the Sanford C. Bernstein Fund II, Inc.Intermediate Duration Institutional Portfolio
(the Portfolio). The annual report covers the six- and 12-month periods ended September 30, 2022, and includes financial statements as well as notes to
the financial statements, information about the recent performance of the Portfolio and a listing of the Portfolios holdings as of the period end.
Global equity markets have been challenged over the 12-month period ended September 30, 2022, with most stock
indices down more than 20%, the conventional threshold defining a bear market. In addition, volatility has been elevated throughout most of 2022, marking a turbulent period for investors. Significant economic and geopolitical stress created a tough
macroeconomic backdrop, with both inflation and central banks interest-rate policies coming in higher than the markets anticipated.
One of the
greatest surprises for markets has been the outperformance of the US dollar, which has negatively impacted US companies earnings coming from overseas, while geopolitical forces continue to put pressure on international earnings and economic
growth. In contrast to most of the past decade, value stocks have outperformed growth stocks, but stock selection overall has been challenging. Our equity funds seek to find balanced exposure across factors and the portfolio teams have been pivoting
to companies with strong balance sheets, pricing power and defensive characteristics, while also seeking to capture opportunities due to valuation dislocations.
The pressure on inflation and interest rates has also made the past year one of the worst on record for fixed-income markets. While this has been very
painful for investors, the portfolio teams are leaning into higher yielding issues, with yields notably higher than they were even at the beginning of this calendar year.
Looking ahead, we are carefully minding the odds of recessions in the US and around the world. In this environment, we are confident in our portfolio
teams ability to find the right balance to position for the eventual rebound and the opportunities that are being created today. Thank you for your continued confidence in our approach.
If you have any questions about your investments in the Portfolio, please contact your Bernstein Advisor by calling 212.756.4097, or visit www.Bernstein.com.
As always, we are firmly dedicated to your investment success.
Sincerely,
Onur Erzan
President and Chief Executive Officer
Sanford C. Bernstein Fund II, Inc.
Investment Objectives and Policies
The Portfolio seeks
to provide safety of principal and a moderate to high rate of current income. The Portfolio seeks to maintain an average portfolio quality minimum of A, based on ratings given to the Portfolios securities by any nationally recognized
statistical rating organization (NRSRO) (or, if unrated, determined by AllianceBernstein L.P., the Portfolios investment adviser (the Adviser), to be of comparable quality). Many types of securities may be purchased by
the Portfolio, including corporate bonds, notes, US government and agency securities, asset-backed securities, mortgage-related securities, bank loan debt, preferred stock and inflation-protected securities, as well as others. The Portfolio may also
invest up to 25% of its total assets in fixed-income, non-US dollar denominated foreign securities, and may invest without limit in fixed-income, US dollar denominated foreign securities, in each case in
developed- or emerging-market countries.
The Portfolio may use derivatives, such as options, futures contracts, forward contracts and swaps.
The Portfolio may invest up to 25% of its total assets in fixed-income securities rated below investment-grade (BB or below) by NRSROs (commonly known as
junk bonds). No more than 5% of the Portfolios total assets may be invested in fixed-income securities rated CCC by NRSROs.
In
managing the Portfolio, the Adviser may use interest-rate forecasting to estimate an appropriate level of interest-rate risk at a given time. The Adviser may moderately shorten the average duration of the Portfolio when it expects interest rates to
rise and moderately lengthen average duration when it anticipates that interest rates will fall.
(Portfolio Manager Commentary continued on next page)
|
2022 Annual Report |
1 | |
Table of Contents
Portfolio Manager Commentary (continued)
The Portfolio seeks
to maintain an effective duration of three to seven years under normal market conditions. Duration is a measure that relates the expected price volatility of a security to changes in interest rates. The duration of a debt security is the weighted
average term to maturity, expressed in years, of the present value of all future cash flows, including coupon payments and principal repayments.
The
Adviser selects securities for purchase or sale based on its assessment of the securities risk and return characteristics as well as the securities impact on the overall risk and return characteristics of the Portfolio. In making this
assessment, the Adviser takes into account various factors including the credit quality and sensitivity to interest rates of the securities under consideration and of the Portfolios other holdings.
The Portfolio may enter into foreign currency transactions on a spot (i.e., cash) basis or through the use of derivatives transactions, such as
forward currency exchange contracts, currency futures and options thereon, and options on currencies. An appropriate hedge of currency exposure resulting from the Portfolios securities positions may not be available or cost effective, or the
Adviser may determine not to hedge the positions, possibly even under market conditions where doing so could benefit the Portfolio.
Investment Results
The table on page 8 shows the Portfolios performance compared to its benchmark, the Bloomberg US Aggregate Bond Index, for the six- and 12-month periods ended September 30, 2022. The table also includes the Portfolios peer group, as represented by the Lipper Core Bond Funds Average (the
Lipper Average). Funds in the Lipper Average have generally similar investment objectives to the Portfolio, although some of the funds may have different investment policies, sales and management fees, and fund expenses.
During both periods, the Portfolio underperformed the benchmark and outperformed the Lipper Average. In the 12-month
period, yield-curve positioning was the largest detractor, relative to the benchmark, mostly from overweights to the five- and 10-year parts of the curve that were partially offset by an overweight to the six-month part of the curve and an underweight to the 20-year part of the yield curve. Security selection also detracted, as selection within investment-grade corporate bonds,
asset-backed securities and US agency mortgages outweighed a gain from selection within commercial mortgage-backed securities (CMBS). Sector allocation contributed, due primarily to gains from an underweight to US agency mortgages, an
overweight to asset-backed securities and exposure to US inflation-linked bonds that were greater than losses from allocation to collateralized loan obligations, agency risk-sharing transactions and eurozone high-yield corporate bonds. Currency
decisions also contributed, mainly from short positions in the Swedish krona and offshore Chinese renminbi. Country allocation was a minor contributor to performance during the period.
During the six-month period, security selection within investment-grade corporate bonds and asset-backed securities
was the largest detractor, offset by gains from selection within CMBS. Country allocation to Japan and the UK also detracted, offset partially by allocation to the eurozone. Yield-curve positioning was a minor detractor to performance. Currency
decisions contributed the most to performance, due to short positions in the offshore Chinese renminbi, Australian dollar and Canadian dollar. Sector allocation also contributed, as gains from an underweight to US agency mortgages, an overweight to
asset-backed securities and exposure to US inflation-linked bonds were larger than a loss from exposure to collateralized mortgage obligations and agency risk-sharing transactions.
During both periods, the Portfolio utilized derivatives in the form of interest rate swaps and futures to manage and hedge duration risk and/or to take
active yield-curve positioning. Currency forwards were used to hedge foreign currency exposure and to take active currency risk. Inflation swaps were used to hedge inflation and for investment purposes to incorporate the Portfolios Investment
Management Teams view on future inflation in the Portfolio. Credit default swaps were utilized to hedge credit risk and as a tool to effectively gain exposure to specific sectors. The utilization of government-agency-related To Be Announced
mortgage positions was a significant contributor to the Portfolios turnover rate of 129%.
Market Review and Investment Strategy
During the 12-month period ended September 30, 2022, fixed-income government bond market yields increased
rapidly, and bond prices fell in all developed markets. Most major central banks aggressively tightened monetary policy by raising short-term interest rates and ending bond purchases to combat high and persistent inflation. Developed-market
government bonds fell the most in the UK and eurozone, and by the least in Japan. In credit risk sectors, securitized assets generally outperformed corporate bonds. Investment-grade corporate bonds trailed
(Portfolio Manager Commentary continued on next page)
| 2 |
Sanford C. Bernstein Fund II, Inc. |
|
Table of Contents
Portfolio Manager Commentary (continued)
treasuries,
underperforming in the US against US Treasuries, while outperforming in the eurozone relative to eurozone treasuries. High-yield corporate bonds trailed in the US versus US Treasuries while eurozone high yield outperformed eurozone treasuries.
Investment-grade emerging-market corporate bonds slightly trailed developed-market corporates.
Longer-maturity emerging-market sovereign bonds
underperformed developed-market treasuries. Emerging-market local-currency bonds lagged as the US dollar advanced against almost all developed- and emerging-market currencies. Brent crude oil prices ended the period higher, even as prices fell
sharply in the final quarter on global growth concerns and reduced demand.
|
2022 Annual Report |
3 | |
Table of Contents
Disclosures and Risks (Unaudited)
Benchmark Disclosures
None of the following indices or averages reflects fees and expenses associated with the active management of a mutual fund portfolio. The Bloomberg
US Aggregate Bond Index represents the performance of securities within the US investment-grade fixed-rate bond market, with index components for government and corporate securities, mortgage pass-through securities, asset-backed securities and
CMBS. The Lipper Core Bond Funds Average is the equal-weighted average returns of the portfolios in the relevant Lipper Inc. category; the average portfolios in a category may differ in composition from the Portfolio. The Lipper Core Bond Funds
Average contains portfolios that invest primarily in investment-grade debt issues (rated in the top four grades) with dollar-weighted average maturities of five to ten years. An investor cannot invest directly in an index or average, and their
results are not indicative of the performance for any specific investment, including the Portfolio.
A Word About Risk
The share price of the Portfolio will fluctuate and you may lose money. There is no guarantee that the Portfolio will achieve its investment objective.
Cybersecurity Risk: As the use of the internet and other technologies has become more prevalent in the course of business, the Portfolio has become
more susceptible to operational and financial risks associated with cybersecurity. Cybersecurity incidents can result from deliberate attacks such as gaining unauthorized access to digital systems (e.g., through hacking or
malicious software coding) for purposes of misappropriating assets or sensitive information, corrupting data, or causing operational disruption, or from unintentional events, such as the inadvertent release of confidential information. Cybersecurity
failures or breaches of the Portfolio or its service providers or the issuers of securities in which the Portfolio invests have the ability to cause disruptions and impact business operations, potentially resulting in financial losses, the inability
of Portfolio shareholders to transact business, violations of applicable privacy and other laws, regulatory fines, penalties, reputational damage, reimbursement or other compensation costs, and/or additional compliance costs. While measures have
been developed which are designed to reduce the risks associated with cybersecurity, there is no guarantee that those measures will be effective, particularly since the Portfolio does not control the cybersecurity defenses or plans of its service
providers, financial intermediaries and companies in which it invests or with which they do business.
Cybersecurity incidents, both intentional and
unintentional, may allow an unauthorized party to gain access to Portfolio or shareholder assets, Portfolio or customer data (including private shareholder information), or proprietary information, or cause a Portfolio, the Adviser, and/or the
Portfolios service providers (including, but not limited to, fund accountants, custodians, sub-custodians, transfer agents and financial intermediaries) to suffer data breaches, data corruption or lose
operational functionality, or prevent Portfolio investors from purchasing, redeeming or exchanging shares or receiving distributions. A Portfolio and the Adviser have limited ability to prevent or mitigate cybersecurity incidents affecting
third-party service providers. Cybersecurity incidents may result in financial losses to such Portfolio and its shareholders, and substantial costs may be incurred in order to prevent any future cybersecurity incidents.
Interest-Rate Risk: Changes in interest rates will affect the value of investments in fixed-income securities. When interest rates rise, the value of
existing investments in fixed-income securities tends to fall and this decrease in value may not be offset by higher income from new investments. Interest-rate risk is generally greater for fixed-income securities with longer maturities or
durations. The Portfolio may be subject to greater risk of rising interest rates than would normally be the case due to the end of a recent period of historically low rates and the effect of potential government fiscal and monetary policy
initiatives and resulting market reaction to those initiatives.
Credit Risk: This is the risk that the issuer or the guarantor of a debt
security, or the counterparty to a derivatives or other contract, will be unable or unwilling to make timely principal and/or interest payments, or to otherwise honor its obligations. The issuer or guarantor may default, potentially causing a loss
of the full principal amount of a security and accrued interest. The degree of risk for a particular security may be reflected in its credit rating. The credit rating of a fixed-income security may be downgraded after purchase, which may adversely
affect the value of the security. Investments in fixed-income securities with lower ratings tend to have a higher probability that an issuer will default or fail to meet its payment obligations, making credit risk greater for medium-quality and
lower-rated debt securities. Lower-rated debt securities and similar unrated securities (commonly known as junk bonds) have speculative elements or are predominantly speculative credit risks. At times when credit risk is perceived to be
(Disclosures and Risks continued on next page)
| 4 |
Sanford C. Bernstein Fund II, Inc. |
|
Table of Contents
Disclosures and Risks (continued)
greater, credit
spreads (i.e., the difference between the yields on lower quality securities and the yields on higher quality securities) may get larger or widen. As a result, the values of the lower quality securities may go down
more and they may become harder to sell.
Duration Risk: The duration of a fixed-income security may be shorter than or equal to full maturity of
the fixed-income security. Fixed-income securities with longer durations have more interest-rate risk and will decrease in price as interest rates rise. Securities that have final maturities longer than their durations may be affected by increased
credit spreads to a far greater degree than their durations would suggest, because they are exposed to credit risk until final maturity.
Inflation
Risk: This is the risk that the value of assets or income from investments will be less in the future as inflation decreases the value of money. As inflation increases, the value of the Portfolios assets can decline as can the value of the
Portfolios distributions. This risk is significantly greater for fixed-income securities with longer maturities. Rates of inflation have recently risen, which could adversely affect economies and markets.
Inflation-Protected Securities Risk: The terms of inflation-protected securities provide for the coupon and/or maturity value to be adjusted based on
changes in an inflation index. Decreases in the inflation rate or in investors expectations about inflation could cause these securities to underperform non-inflation-adjusted securities on a
total-return basis. In addition, there can be no assurance that the relevant inflation index will accurately measure the rate of inflation, in which case the securities may not work as intended. These securities may be more difficult to trade or
dispose of than other types of securities.
Foreign (Non-US) Securities Risk: Investments in foreign
securities entail significant risks in addition to those customarily associated with investing in securities such as less liquid, less transparent, less regulated and more volatile markets. These risks include risks related to unfavorable or
unsuccessful government actions, reduction of government or central bank support, inadequate accounting standards and auditing and financial recordkeeping requirements, lack of information, and adverse market, economic, political and regulatory
factors and social instability, all of which could disrupt the financial markets in which the Portfolio invests and adversely affect the value of the Portfolios assets.
Emerging-Markets Securities Risk: The risks of investing in foreign (non-US) securities are heightened with
respect to issuers in emerging-market countries because the markets are less developed and less liquid and there may be a greater amount of economic, political and social uncertainty, and these risks are even more pronounced in frontier
markets, which are investable markets with lower total market capitalization and liquidity than the more developed emerging markets. Emerging markets typically have fewer medical and economic resources than more developed countries, and thus they
may be less able to control or mitigate the effects of a pandemic. In addition, the value of the Portfolios investments may decline because of factors such as unfavorable or unsuccessful government actions and reduction of government or
central bank support.
Derivatives Risk: The Portfolio may use derivatives as direct investments to earn income, enhance return and broaden
portfolio diversification, which entail greater risk than if used solely for hedging purposes. In addition to other risks such as the credit risk of the counterparty, derivatives involve the risk that changes in the value of the derivative may not
correlate with relevant assets, rates or indices. Derivatives may be difficult to price or unwind, and small changes may produce disproportionate losses for the Portfolio. Certain derivatives have the potential for unlimited loss, regardless of the
size of the initial investment. Assets required to be set aside or posted to cover or secure derivatives positions may themselves go down in value, and these collateral and other requirements may limit investment flexibility. Some derivatives
involve leverage, which can make the Portfolio more volatile and can compound other risks. Derivatives, especially over-the-counter derivatives, are also subject to
counterparty risk, which is the risk that the counterparty (the party on the other side of the transaction) on a derivative transaction will be unable or unwilling to honor its contractual obligations to the Portfolio. Use of derivatives may have
different tax consequences for the Portfolio than an investment in the underlying asset or index, and such differences may affect the amount, timing and character of income distributed to shareholders. The US government and certain foreign
governments have adopted regulations governing derivatives markets, including mandatory clearing of certain derivatives as well as additional regulations governing margin, reporting and registration requirements. The ultimate impact of the
regulations remains unclear. Additional regulation may make derivatives more costly, limit their availability or utility, otherwise adversely affect their performance, or disrupt markets.
(Disclosures and Risks continued on next page)
|
2022 Annual Report |
5 | |
Table of Contents
Disclosures and Risks (continued)
Mortgage-Related
Securities Risk: Mortgage-related securities represent interests in pools of mortgages, including consumer loans or receivables held in trust. Mortgage-related securities are subject to credit, interest-rate, prepayment and extension
risks. These securities also are subject to risk of default on the underlying mortgage, particularly during periods of economic downturn. Small movements in interest rates (both increases and decreases) may quickly and significantly reduce the value
of certain mortgage-related securities. Asset-related securities entail certain risks not presented by mortgage-backed securities, including the risk that it may be difficult to perfect the liens securing any collateral backing certain asset-backed
securities.
Prepayment and Extension Risk: Prepayment risk is the risk that a loan, bond or other security might be called or otherwise
converted, prepaid or redeemed before maturity. If this happens, particularly during a time of declining interest rates or credit spreads, the Portfolio will not benefit from the rise in market price that normally accompanies a decline in interest
rates, and may not be able to invest the proceeds in securities providing as much income, resulting in a lower yield to the Portfolio. Conversely, extension risk is the risk that as interest rates rise or spreads widen, payments of securities may
occur more slowly than anticipated by the market. If this happens, the values of these securities may go down because their interest rates are lower than current market rates and they remain outstanding longer than anticipated.
Subordination Risk: The Portfolio may invest in securities that are subordinated to more senior securities of an issuer, or which represent interests
in pools of such subordinated securities. Subordinated securities will be disproportionately affected by a default or even a perceived decline in creditworthiness of the issuer. Subordinated securities are more likely to suffer a credit loss than non-subordinated securities of the same issuer, any loss incurred by the subordinated securities is likely to be proportionately greater, and any recovery of interest or principal may take more time.
Management Risk: The Portfolio is subject to management risk because it is an actively managed investment portfolio. The Adviser will apply its
investment techniques and risk analyses in making investment decisions for the Portfolio, but these techniques, analyses and decisions may not work as intended or may not produce the desired results, and may, during certain periods, result in
increased volatility for the Portfolio or cause the value of the Portfolios shares to go down. In some cases, derivatives and other investment techniques may be unavailable or the Adviser may determine not to use them, possibly even under
market conditions where their use could benefit the Portfolio. Some of these techniques may incorporate, or rely upon, quantitative models, but there is no guarantee that these models will generate accurate forecasts, reduce risk or otherwise
perform as expected. In addition, the Adviser may change the Portfolios investment strategies or policies from time to time. Those changes may not lead to the results intended by the Adviser and could have an adverse on effect the value or
performance of the Portfolio.
Illiquid Investments Risk: Illiquid investments risk exists when particular investments are difficult or impossible
to purchase or sell, possibly preventing the Portfolio from purchasing or selling these securities at an advantageous price. Over recent years, regulatory changes have led to reduced liquidity in the marketplace, and the capacity of dealers to make
markets in fixed-income securities has been outpaced by the growth in the size of the fixed-income markets. Illiquid investments risk may be magnified in a rising interest-rate environment, where the value and liquidity of fixed-income securities
generally go down.
Redemption Risk: The Portfolio may experience heavy redemptions that could cause the Portfolio to liquidate its assets at
inopportune times or unfavorable prices or increase or accelerate taxable gains or transaction costs and may negatively affect the Portfolios net asset value or performance, which could cause the value of your investment to decline. Redemption
risk is heightened during periods of overall market turmoil.
Foreign Currency Risk: This is the risk that changes in foreign (non-US) currency exchange rates may negatively affect the value of the Portfolios investments or reduce the returns of the Portfolio. For example, the value of the Portfolios investments in foreign
securities and foreign currency positions may decrease if the US dollar is strong (i.e., gaining value relative to other currencies) and other currencies are weak (i.e., losing value relative to the US dollar).
Actions by a Few Major Investors: In certain countries, volatility may be heightened by actions of a few major investors. For example, substantial
increases or decreases in cash flows of mutual funds investing in these markets could significantly affect local securities prices and, therefore, share prices of the Portfolio.
Market Risk: The Portfolio is subject to market risk, which is the risk that stock or bond prices in general or in particular
(Disclosures and Risks continued on next page)
| 6 |
Sanford C. Bernstein Fund II, Inc. |
|
Table of Contents
Disclosures and Risks (continued)
countries or sectors
may decline over short or extended periods. Stock or bond prices may decline in response to adverse changes in the economy or the economic outlook; deterioration in investor sentiment; interest-rate, currency and commodity price fluctuations;
adverse geopolitical, social or environmental developments; issuer- and sector-specific considerations; public health crises (including the occurrence of a contagious disease or illness); policy and legislative changes; cybersecurity events; and
other factors.
Economies and financial markets throughout the world are becoming increasingly interconnected. Economic, financial or political events,
trading and tariff arrangements, sanctions, regional and global conflicts, terrorism, natural disasters (including the spread of infectious illness) and other circumstances in one country or region could have profound impacts on global economies or
markets. As a result, whether or not the Portfolio invests in securities of issuers located in or with significant exposure to countries experiencing economic and financial difficulties, the value and liquidity of the Portfolios investments
may be negatively affected.
Lower-rated Securities Risk: Lower-rated securities, or junk bonds/high-yield securities, are subject to greater risk
of loss of principal and interest and greater market risk than higher-rated securities. The capacity of issuers of lower-rated securities to pay interest and repay principal is more likely to weaken than is that of issuers of higher-rated securities
in times of deteriorating economic conditions or rising interest rates.
These risks are discussed in further detail in the Portfolios prospectus.
An Important Note About Historical Performance
Except as noted, returns do not reflect the deduction of taxes that a shareholder would pay on portfolio distributions or the redemption of portfolio
shares. All fees and expenses related to the operation of the Portfolio have been deducted.
The performance shown in this report represents past
performance and does not guarantee future results. Performance information is as of the dates shown. Current performance may be lower or higher than the performance information shown. You may obtain performance information current to the most recent
month-end by visiting www.Bernstein.com or by calling 212.756.4097. The investment return and principal value of an investment in the Portfolio will fluctuate, so that shares, when redeemed, may be worth more
or less than their original cost.
|
2022 Annual Report |
7 | |
Table of Contents
Historical Performance (Unaudited)
Intermediate Duration Institutional Portfolio vs. Its
Benchmark and Lipper Average
| TOTAL RETURNS | AVERAGE ANNUAL TOTAL RETURNS | |||||||||||||||||||||||
| THROUGH SEPTEMBER 30, 2022 | PAST SIX MONTHS |
PAST 12 MONTHS |
PAST FIVE YEARS |
PAST 10 YEARS |
SINCE INCEPTION |
INCEPTION DATE | ||||||||||||||||||
|
Intermediate Duration Institutional Portfolio1 |
-9.61 | % | -15.13 | % | -0.28 | % | 1.16 | % | 3.55 | % | 5/17/2002 | |||||||||||||
|
Bloomberg US Aggregate Bond Index |
-9.22 | % | -14.60 | % | -0.27 | % | 0.89 | % | 3.35 | % | ||||||||||||||
|
Lipper Core Bond Funds Average |
-9.67 | % | -15.18 | % | -0.34 | % | 0.83 | % | | |||||||||||||||
| 1 | There are no sales charges associated with an investment in the Portfolio. Total returns and average annual returns are therefore the same. |
The current prospectus table shows the total annual operating expense ratio for the Portfolio as 0.52%, gross of any fee waivers or expense reimbursements. Contractual
fee waivers and/or expense reimbursements reduced the total annual operating expense ratio to 0.45%. These waivers/reimbursements may not be terminated before January 28, 2023, and may be extended by the Adviser for additional one-year terms. Absent reimbursements or waivers, performance would have been lower. The Financial Highlights section of this report sets forth expense ratio data for the current reporting period; the expense ratio
shown above may differ from the expense ratio in the Financial Highlights section since they are based on different time periods.
| Growth of a $25,000 Investment in the Portfolio | ||
|
|
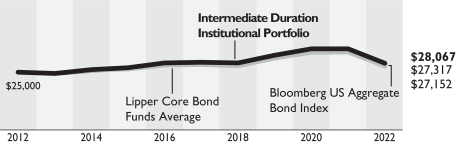
The chart illustrates the total value of an assumed $25,000 minimum investment as compared to the performance of the Portfolios
benchmark and Lipper Average for the 10-year period ended September 30, 2022.
Portfolio
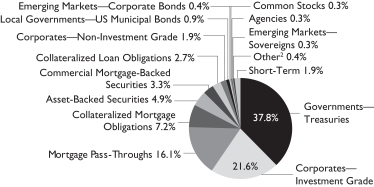
SummarySeptember 30, 2022 (Unaudited)
| Security Type Breakdown1 | ||||
|
||||
| 1 | All data are as of September 30, 2022. The Portfolios security type breakdown is expressed as a percentage of total investments and may vary over time. The Portfolio also enters into derivative transactions, which may be used for hedging or investment purposes (see Schedule of Investments section of the report for additional details). |
| 2 | Other represents less than 0.3% in GovernmentsSovereign Bonds and Quasi-Sovereigns. |
See Disclosures, Risks and Note About Historical Performance on pages 4-7.
| 8 |
Sanford C. Bernstein Fund II, Inc. |
|
Table of Contents
Expense ExampleSeptember 30, 2022 (Unaudited)
As a shareholder of the Fund, you incur various types of costs including management
fees and other Fund expenses. This example is intended to help you understand your ongoing costs (in dollars) of investing in the Fund and to compare these costs with the ongoing costs of investing in other mutual funds. The example is based on an
investment of $1,000 invested at the beginning of the period and held for the entire period as indicated below.
Actual ExpensesThe first
line of the table below provides information about actual account values and actual expenses. You may use the information in this line, together with the amount you invested, to estimate the expenses that you paid over the period. Simply divide your
account value by $1,000 (for example, an $8,600 account value divided by $1,000 = 8.6), then multiply the result by the number in the first line under the heading entitled Expenses Paid During Period to estimate the expenses you paid on
your account during this period.
Hypothetical Example for Comparison PurposesThe second line of the table below provides information about
hypothetical account values and hypothetical expenses based on the Funds actual expense ratio and an assumed annual rate of return of 5% before expenses, which is not the Funds actual return. The hypothetical account values and expenses
may not be used to estimate the actual ending account balance or expenses you paid for the period. You may use this information to compare the ongoing costs of investing in the Fund and other funds by comparing this 5% hypothetical example with the
5% hypothetical examples that appear in the shareholder reports of other funds. Please note that the expenses shown in the table are meant to highlight your ongoing costs only and do not reflect any transactional costs, such as sales charges
(loads), or contingent deferred sales charges on redemptions. Therefore, the second line of the table is useful in comparing ongoing costs only, and will not help you determine the relative total costs of owning different funds. In addition, if
these transactional costs were included, your costs would have been higher.
| BEGINNING ACCOUNT VALUE APRIL 1, 2022 |
ENDING ACCOUNT VALUE SEPTEMBER 30, 2022 |
EXPENSES PAID DURING PERIOD* |
ANNUALIZED EXPENSE RATIO* |
|||||||||||||
|
SCB Intermediate Duration Institutional Portfolio |
||||||||||||||||
|
Actual |
$ | 1,000 | $ | 903.90 | $ | 2.15 | 0.45 | % | ||||||||
|
Hypothetical** |
$ | 1,000 | $ | 1,022.81 | $ | 2.28 | 0.45 | % | ||||||||
| * | Expenses are equal to the classes annualized expense ratios, multiplied by the average account value over the period, multiplied by 183/365 (to reflect the one-half year period). |
| ** | Assumes 5% annual return before expenses. |
|
2022 Annual Report |
9 | |
Table of Contents
Sanford C. Bernstein Fund, Inc.
Schedule of Investments
Intermediate Duration Institutional Portfolio
September 30, 2022
| Principal Amount (000) | U.S. $ Value | |||||||||||
| GOVERNMENTSTREASURIES40.5% |
|
|||||||||||
| United States40.5% |
|
|||||||||||
|
U.S. Treasury Bonds |
U.S.$ | 8,149 | $ | 5,568,990 | ||||||||
|
1.875%, 02/15/2051 |
4,063 | 2,689,330 | ||||||||||
|
2.00%, 11/15/2041 |
6,894 | 4,931,364 | ||||||||||
|
2.00%, 08/15/2051 |
9,349 | 6,383,887 | ||||||||||
|
2.25%, 08/15/2046 |
2,377 | 1,712,854 | ||||||||||
|
2.25%, 08/15/2049 |
15,570 | 11,395,294 | ||||||||||
|
2.25%, 02/15/2052 |
1,672 | 1,214,072 | ||||||||||
|
2.375%, 02/15/2042 |
1,736 | 1,329,939 | ||||||||||
|
2.375%, 11/15/2049 |
4,905 | 3,694,078 | ||||||||||
|
2.50%, 02/15/2046 |
932 | 708,029 | ||||||||||
|
2.50%, 05/15/2046 |
5,327 | 4,040,272 | ||||||||||
|
2.75%, 08/15/2042 |
190 | 154,286 | ||||||||||
|
2.875%, 05/15/2043 |
165 | 135,970 | ||||||||||
|
2.875%, 08/15/2045 |
51 | 41,963 | ||||||||||
|
2.875%, 11/15/2046 |
387 | 316,252 | ||||||||||
|
2.875%, 05/15/2052 |
2,950 | 2,473,768 | ||||||||||
|
3.00%, 05/15/2042 |
843 | 716,945 | ||||||||||
|
3.00%, 11/15/2044 |
200 | 166,843 | ||||||||||
|
3.00%, 05/15/2045 |
129 | 107,298 | ||||||||||
|
3.00%, 11/15/2045 |
363 | 303,242 | ||||||||||
|
3.00%, 05/15/2047(a) |
1,447 | 1,212,315 | ||||||||||
|
3.00%, 02/15/2048 |
5,490 | 4,625,325 | ||||||||||
|
3.125%, 02/15/2043 |
280 | 240,625 | ||||||||||
|
3.125%, 08/15/2044 |
50 | 42,727 | ||||||||||
|
3.25%, 05/15/2042 |
7,885 | 6,995,473 | ||||||||||
|
3.375%, 05/15/2044 |
646 | 575,794 | ||||||||||
|
3.50%, 02/15/2039 |
8,105 | 7,709,881 | ||||||||||
|
3.625%, 08/15/2043 |
1,943 | 1,811,613 | ||||||||||
|
3.625%, 02/15/2044 |
38 | 35,316 | ||||||||||
|
3.75%, 11/15/2043 |
295 | 280,158 | ||||||||||
|
4.375%, 02/15/2038 |
899 | 955,711 | ||||||||||
|
4.375%, 11/15/2039 |
10,740 | 11,327,344 | ||||||||||
|
4.50%, 02/15/2036 |
1,074 | 1,159,872 | ||||||||||
|
4.75%, 02/15/2037 |
1,525 | 1,688,937 | ||||||||||
|
5.375%, 02/15/2031 |
3,646 | 4,024,732 | ||||||||||
|
U.S. Treasury Notes |
67,065 | 65,828,293 | ||||||||||
|
1.375%, 11/15/2031 |
14,097 | 11,449,326 | ||||||||||
|
1.50%, 02/15/2030(b) |
10,851 | 9,209,786 | ||||||||||
|
1.625%, 11/15/2022 |
165 | 164,665 | ||||||||||
|
1.625%, 04/30/2023 |
5,514 | 5,437,321 | ||||||||||
|
1.625%, 05/15/2026 |
43,357 | 39,637,417 | ||||||||||
|
1.625%, 05/15/2031 |
3,253 | 2,730,403 | ||||||||||
|
1.75%, 11/15/2029 |
1,386 | 1,204,087 | ||||||||||
|
2.125%, 12/31/2022 |
11,453 | 11,415,420 | ||||||||||
|
2.625%, 02/15/2029 |
8,921 | 8,221,259 | ||||||||||
|
2.75%, 11/15/2023 |
160 | 157,250 | ||||||||||
|
2.75%, 07/31/2027 |
15,239 | 14,358,090 | ||||||||||
| Principal Amount (000) | U.S. $ Value | |||||||||||
|
2.75%, 08/15/2032 |
U.S.$ | 4,508 | $ | 4,119,707 | ||||||||
|
2.875%, 05/15/2032 |
2,657 | 2,455,557 | ||||||||||
|
3.00%, 07/31/2024 |
20,003 | 19,562,309 | ||||||||||
|
|
|
|||||||||||
| Total GovernmentsTreasuries (cost $325,451,051) |
|
286,721,389 | ||||||||||
|
|
|
|||||||||||
| CORPORATESINVESTMENT GRADE23.2% |
|
|||||||||||
| Industrial12.5% |
|
|||||||||||
| Basic0.8% |
|
|||||||||||
|
Anglo American Capital PLC |
403 | 345,270 | ||||||||||
|
Braskem Netherlands Finance BV |
500 | 401,900 | ||||||||||
|
Celanese US Holdings LLC |
1,494 | 1,473,995 | ||||||||||
|
Freeport Indonesia PT |
324 | 293,220 | ||||||||||
|
Inversiones CMPC SA |
200 | 161,413 | ||||||||||
|
Inversiones CMPC SA/Cayman Islands Branch |
322 | 318,848 | ||||||||||
|
LYB International Finance BV |
187 | 185,201 | ||||||||||
|
LyondellBasell Industries NV |
568 | 572,396 | ||||||||||
|
Suzano Austria GmbH |
343 | 267,540 | ||||||||||
|
WRKCo., Inc. |
1,732 | 1,598,775 | ||||||||||
|
|
|
|||||||||||
| 5,618,558 | ||||||||||||
|
|
|
|||||||||||
| Capital Goods1.0% |
|
|||||||||||
|
CNH Industrial Capital LLC |
1,191 | 1,148,672 | ||||||||||
|
Flowserve Corp. |
1,227 | 878,716 | ||||||||||
|
Parker-Hannifin Corp. |
743 | 655,185 | ||||||||||
|
4.50%, 09/15/2029 |
934 | 884,050 | ||||||||||
|
Raytheon Technologies Corp. |
2,242 | 2,097,839 | ||||||||||
|
Westinghouse Air Brake Technologies Corp. |
270 | 252,296 | ||||||||||
|
4.40%, 03/15/2024 |
1,145 | 1,124,413 | ||||||||||
|
|
|
|||||||||||
| 7,041,171 | ||||||||||||
|
|
|
|||||||||||
| CommunicationsMedia1.3% |
|
|||||||||||
|
Charter Communications Operating LLC/Charter Communications Operating Capital |
467 | 344,599 | ||||||||||
|
Discovery Communications LLC |
509 | 376,467 | ||||||||||
| 10 |
Sanford C. Bernstein Fund II, Inc. |
|
Table of Contents
| Principal Amount (000) | U.S. $ Value | |||||||||||
|
Fox Corp. |
U.S.$ | 700 | $ | 658,070 | ||||||||
|
Interpublic Group of Cos., Inc. (The) |
519 | 480,895 | ||||||||||
|
Prosus NV |
489 | 409,537 | ||||||||||
|
3.68%, 01/21/2030(c) |
639 | 483,787 | ||||||||||
|
4.027%, 08/03/2050(c) |
485 | 272,813 | ||||||||||
|
Tencent Holdings Ltd. |
1,256 | 1,124,355 | ||||||||||
|
3.24%, 06/03/2050(c) |
1,022 | 610,198 | ||||||||||
|
Time Warner Cable LLC |
505 | 350,117 | ||||||||||
|
Warnermedia Holdings, Inc. |
1,826 | 1,503,455 | ||||||||||
|
Weibo Corp. |
3,313 | 2,441,888 | ||||||||||
|
|
|
|||||||||||
| 9,056,181 | ||||||||||||
|
|
|
|||||||||||
| Consumer CyclicalAutomotive0.3% |
|
|||||||||||
|
General Motors Co. |
278 | 278,623 | ||||||||||
|
General Motors Financial Co., Inc. |
171 | 149,001 | ||||||||||
|
Harley-Davidson Financial Services, Inc. |
930 | 797,884 | ||||||||||
|
3.35%, 06/08/2025(c) |
890 | 835,550 | ||||||||||
|
|
|
|||||||||||
| 2,061,058 | ||||||||||||
|
|
|
|||||||||||
| Consumer CyclicalOther0.4% |
|
|||||||||||
|
Las Vegas Sands Corp. |
2,303 | 1,908,473 | ||||||||||
|
MDC Holdings, Inc. |
968 | 737,529 | ||||||||||
|
|
|
|||||||||||
| 2,646,002 | ||||||||||||
|
|
|
|||||||||||
| Consumer CyclicalRetailers0.4% |
|
|||||||||||
|
Lowes Cos., Inc. |
1,126 | 1,035,334 | ||||||||||
|
Ross Stores, Inc. |
1,925 | 1,879,859 | ||||||||||
|
|
|
|||||||||||
| 2,915,193 | ||||||||||||
|
|
|
|||||||||||
| Consumer Non-Cyclical1.1% |
|
|||||||||||
|
Altria Group, Inc. |
1,745 | 1,415,841 | ||||||||||
|
BAT Capital Corp. |
2,706 | 2,155,302 | ||||||||||
|
4.906%, 04/02/2030 |
917 | 807,840 | ||||||||||
|
Cigna Corp. |
740 | 698,834 | ||||||||||
|
CVS Health Corp. |
87 | 82,286 | ||||||||||
|
Ochsner LSU Health System of North Louisiana |
1,480 | 1,131,860 | ||||||||||
| Principal Amount (000) | U.S. $ Value | |||||||||||
|
Takeda Pharmaceutical Co., Ltd. |
U.S.$ | 1,378 | $ | 1,378,000 | ||||||||
|
|
|
|||||||||||
| 7,669,963 | ||||||||||||
|
|
|
|||||||||||
| Energy3.4% |
|
|||||||||||
|
BP Capital Markets America, Inc. |
2,985 | 1,895,326 | ||||||||||
|
Conocophillips Co. |
85 | 68,265 | ||||||||||
|
Continental Resources, Inc./OK |
1,353 | 988,461 | ||||||||||
|
5.75%, 01/15/2031(c) |
1,006 | 909,193 | ||||||||||
|
Devon Energy Corp. |
1,190 | 1,068,180 | ||||||||||
|
Enbridge Energy Partners LP |
1,713 | 1,853,363 | ||||||||||
|
Energy Transfer LP |
100 | 99,540 | ||||||||||
|
6.25%, 04/15/2049 |
882 | 787,811 | ||||||||||
|
EQT Corp. |
451 | 442,891 | ||||||||||
|
Marathon Oil Corp. |
1,800 | 1,800,648 | ||||||||||
|
Marathon Petroleum Corp. |
2,794 | 2,750,162 | ||||||||||
|
6.50%, 03/01/2041 |
415 | 410,916 | ||||||||||
|
MPLX LP |
2,687 | 2,214,222 | ||||||||||
|
Oleoducto Central SA |
491 | 380,003 | ||||||||||
|
ONEOK Partners LP |
73 | 64,798 | ||||||||||
|
ONEOK, Inc. |
1,720 | 1,580,198 | ||||||||||
|
4.35%, 03/15/2029 |
1,012 | 903,382 | ||||||||||
|
6.35%, 01/15/2031 |
263 | 258,061 | ||||||||||
|
Plains All American Pipeline LP/PAA Finance Corp. |
1,059 | 883,407 | ||||||||||
|
4.50%, 12/15/2026 |
683 | 646,364 | ||||||||||
|
Suncor Energy, Inc. |
1,377 | 1,394,268 | ||||||||||
|
Tengizchevroil Finance Co. International Ltd. |
415 | 294,987 | ||||||||||
|
TransCanada PipeLines Ltd. |
1,356 | 1,309,557 | ||||||||||
|
6.20%, 10/15/2037 |
829 | 821,523 | ||||||||||
|
Transcontinental Gas Pipe Line Co., LLC |
449 | 379,185 | ||||||||||
|
|
|
|||||||||||
| 24,204,711 | ||||||||||||
|
|
|
|||||||||||
| Other Industrial0.1% |
|
|||||||||||
|
Alfa SAB de CV |
915 | 907,227 | ||||||||||
|
|
|
|||||||||||
|
2022 Annual Report |
11 | |
Table of Contents
Schedule of Investments (continued)
| Principal Amount (000) | U.S. $ Value | |||||||||||
| Services0.3% |
|
|||||||||||
|
Expedia Group, Inc. |
U.S.$ | 49 | $ | 49,299 | ||||||||
|
Global Payments, Inc. |
275 | 210,724 | ||||||||||
|
3.20%, 08/15/2029 |
845 | 704,874 | ||||||||||
|
5.40%, 08/15/2032 |
944 | 875,145 | ||||||||||
|
S&P Global, Inc. |
411 | 386,459 | ||||||||||
|
4.75%, 08/01/2028(c) |
83 | 81,138 | ||||||||||
|
|
|
|||||||||||
| 2,307,639 | ||||||||||||
|
|
|
|||||||||||
| Technology3.1% |
|
|||||||||||
|
Apple, Inc. |
1,148 | 941,222 | ||||||||||
|
Baidu, Inc. |
203 | 175,079 | ||||||||||
|
Broadcom, Inc. |
323 | 226,465 | ||||||||||
|
3.187%, 11/15/2036(c) |
1,539 | 1,053,800 | ||||||||||
|
4.00%, 04/15/2029(c) |
169 | 148,979 | ||||||||||
|
4.15%, 11/15/2030 |
371 | 320,663 | ||||||||||
|
4.15%, 04/15/2032(c) |
601 | 505,669 | ||||||||||
|
4.926%, 05/15/2037(c) |
1,079 | 892,624 | ||||||||||
|
Entegris Escrow Corp. |
1,270 | 1,126,630 | ||||||||||
|
Fiserv, Inc. |
2,539 | 2,212,485 | ||||||||||
|
HP, Inc. |
1,907 | 1,691,337 | ||||||||||
|
Infor, Inc. |
649 | 584,347 | ||||||||||
|
Intel Corp. |
1,536 | 1,333,371 | ||||||||||
|
International Business Machines Corp. |
1,499 | 1,313,829 | ||||||||||
|
Kyndryl Holdings, Inc. |
2,545 | 2,044,115 | ||||||||||
|
NXP BV/NXP Funding LLC |
1,300 | 1,272,375 | ||||||||||
|
NXP BV/NXP Funding LLC/NXP USA, Inc. |
875 | 732,620 | ||||||||||
|
Oracle Corp. |
1,479 | 1,165,082 | ||||||||||
|
3.60%, 04/01/2040 |
840 | 569,629 | ||||||||||
|
3.65%, 03/25/2041 |
455 | 308,854 | ||||||||||
|
5.375%, 07/15/2040 |
270 | 224,834 | ||||||||||
|
SK Hynix, Inc. |
532 | 391,785 | ||||||||||
|
TSMC Arizona Corp. |
685 | 652,606 | ||||||||||
|
Western Digital Corp. |
1,444 | 985,905 | ||||||||||
|
Workday, Inc. |
242 | 217,040 | ||||||||||
| Principal Amount (000) | U.S. $ Value | |||||||||||
|
3.80%, 04/01/2032 |
U.S.$ | 643 | $ | 559,359 | ||||||||
|
|
|
|||||||||||
| 21,650,704 | ||||||||||||
|
|
|
|||||||||||
| TransportationAirlines0.1% |
|
|||||||||||
|
Delta Air Lines, Inc./SkyMiles IP Ltd. |
819 | 795,740 | ||||||||||
|
|
|
|||||||||||
| TransportationRailroads0.1% |
|
|||||||||||
|
Lima Metro Line 2 Finance Ltd. |
245 | 214,484 | ||||||||||
|
5.875%, 07/05/2034(c) |
398 | 376,536 | ||||||||||
|
|
|
|||||||||||
| 591,020 | ||||||||||||
|
|
|
|||||||||||
| TransportationServices0.1% | ||||||||||||
|
Ashtead Capital, Inc. |
351 | 325,307 | ||||||||||
|
ENA Master Trust |
380 | 279,537 | ||||||||||
|
|
|
|||||||||||
| 604,844 | ||||||||||||
|
|
|
|||||||||||
| 88,070,011 | ||||||||||||
|
|
|
|||||||||||
| Financial Institutions10.3% |
|
|||||||||||
| Banking7.1% |
|
|||||||||||
|
ABN AMRO Bank NV |
269 | 258,399 | ||||||||||
|
Banco de Credito del Peru S.A. |
1,447 | 1,268,657 | ||||||||||
|
Banco Santander SA |
200 | 173,754 | ||||||||||
|
4.175%, 03/24/2028 |
800 | 723,832 | ||||||||||
|
Bank of America Corp. |
924 | 691,401 | ||||||||||
|
2.687%, 04/22/2032 |
2,071 | 1,613,806 | ||||||||||
|
4.376%, 04/27/2028 |
1,652 | 1,548,634 | ||||||||||
|
Bank of Ireland Group PLC |
571 | 558,992 | ||||||||||
|
Barclays PLC |
1,052 | 1,011,182 | ||||||||||
|
BNP Paribas SA |
751 | 642,383 | ||||||||||
|
7.75%, 08/16/2029(c)(d) |
1,517 | 1,405,409 | ||||||||||
|
Capital One Financial Corp. |
1,186 | 994,924 | ||||||||||
|
4.927%, 05/10/2028 |
1,205 | 1,146,991 | ||||||||||
|
Citigroup, Inc. |
941 | 835,392 | ||||||||||
|
4.075%, 04/23/2029 |
1,397 | 1,265,165 | ||||||||||
|
5.95%, 01/30/2023(d) |
481 | 475,483 | ||||||||||
|
Series W |
788 | 664,914 | ||||||||||
|
Series Y |
139 | 111,003 | ||||||||||
|
Credit Suisse Group AG |
1,865 | 1,311,300 | ||||||||||
|
4.194%, 04/01/2031(c) |
799 | 632,337 | ||||||||||
|
6.373%, 07/15/2026(c) |
1,346 | 1,301,084 | ||||||||||
| 12 |
Sanford C. Bernstein Fund II, Inc. |
|
Table of Contents
| Principal Amount (000) | U.S. $ Value | |||||||||||
|
Danske Bank A/S |
U.S.$ | 1,744 | $ | 1,713,829 | ||||||||
|
Deutsche Bank AG/New York NY |
958 | 814,463 | ||||||||||
|
3.961%, 11/26/2025 |
385 | 359,274 | ||||||||||
|
6.119%, 07/14/2026 |
914 | 888,161 | ||||||||||
|
Discover Bank |
386 | 370,799 | ||||||||||
|
Federation des Caisses Desjardins du Quebec |
1,523 | 1,438,671 | ||||||||||
|
Goldman Sachs Group, Inc. (The) |
739 | 558,233 | ||||||||||
|
2.615%, 04/22/2032 |
1,862 | 1,443,478 | ||||||||||
|
Series V |
764 | 607,113 | ||||||||||
|
HSBC Holdings PLC |
715 | 590,254 | ||||||||||
|
5.402%, 08/11/2033 |
581 | 514,342 | ||||||||||
|
6.375%, 03/30/2025(d) |
2,746 | 2,464,810 | ||||||||||
|
JPMorgan Chase & Co. |
2,363 | 1,828,726 | ||||||||||
|
4.851%, 07/25/2028 |
1,570 | 1,506,384 | ||||||||||
|
Series I |
605 | 602,277 | ||||||||||
|
Series V |
27 | 27,000 | ||||||||||
|
Lloyds Banking Group PLC |
250 | 247,167 | ||||||||||
|
Mizuho Financial Group, Inc. |
1,480 | 1,447,100 | ||||||||||
|
Morgan Stanley |
1,502 | 1,353,497 | ||||||||||
|
4.21%, 04/20/2028 |
1,110 | 1,038,250 | ||||||||||
|
Nationwide Building Society |
1,238 | 1,065,769 | ||||||||||
|
Santander Holdings USA, Inc. |
1,584 | 1,522,446 | ||||||||||
|
Santander UK Group Holdings PLC |
1,150 | 1,142,996 | ||||||||||
|
Societe Generale SA |
2,339 | 1,972,409 | ||||||||||
|
Standard Chartered PLC |
885 | 831,847 | ||||||||||
|
4.316% (LIBOR 3 Month + 1.51%), 01/30/2027(c)(d)(e) |
400 | 302,740 | ||||||||||
|
7.75%, 04/02/2023(c)(d) |
200 | 196,002 | ||||||||||
|
Swedbank AB |
600 | 555,114 | ||||||||||
|
UBS Group AG |
256 | 243,195 | ||||||||||
|
7.00%, 02/19/2025(c) |
200 | 189,900 | ||||||||||
|
UniCredit SpA |
459 | 393,101 | ||||||||||
| Principal Amount (000) | U.S. $ Value | |||||||||||
|
US Bancorp |
U.S.$ | 723 | $ | 617,334 | ||||||||
|
Wells Fargo & Co. |
2,052 | 1,667,763 | ||||||||||
|
3.584%, 05/22/2028 |
559 | 505,627 | ||||||||||
|
Series BB |
635 | 537,788 | ||||||||||
|
|
|
|||||||||||
| 50,192,901 | ||||||||||||
|
|
|
|||||||||||
| Brokerage0.4% | ||||||||||||
|
Charles Schwab Corp. (The) |
1,949 | 1,606,873 | ||||||||||
|
Nomura Holdings, Inc. |
1,881 | 1,423,522 | ||||||||||
|
|
|
|||||||||||
| 3,030,395 | ||||||||||||
|
|
|
|||||||||||
| Finance1.3% | ||||||||||||
|
Air Lease Corp. |
702 | 547,195 | ||||||||||
|
2.875%, 01/15/2026 |
175 | 156,898 | ||||||||||
|
3.625%, 04/01/2027 |
76 | 67,330 | ||||||||||
|
Aircastle Ltd. |
2,065 | 1,581,687 | ||||||||||
|
4.125%, 05/01/2024 |
359 | 345,677 | ||||||||||
|
4.25%, 06/15/2026 |
128 | 114,787 | ||||||||||
|
5.25%, 08/11/2025(c) |
906 | 853,443 | ||||||||||
|
Aviation Capital Group LLC |
1,131 | 949,689 | ||||||||||
|
1.95%, 09/20/2026(c) |
390 | 315,873 | ||||||||||
|
3.50%, 11/01/2027(c) |
318 | 264,163 | ||||||||||
|
4.125%, 08/01/2025(c) |
10 | 9,162 | ||||||||||
|
4.375%, 01/30/2024(c) |
312 | 301,579 | ||||||||||
|
4.875%, 10/01/2025(c) |
350 | 326,921 | ||||||||||
|
5.50%, 12/15/2024(c) |
879 | 850,696 | ||||||||||
|
CDBL Funding 1 |
1,460 | 1,333,155 | ||||||||||
|
Synchrony Financial |
1,255 | 891,577 | ||||||||||
|
3.95%, 12/01/2027 |
164 | 142,939 | ||||||||||
|
4.50%, 07/23/2025 |
193 | 184,041 | ||||||||||
|
4.875%, 06/13/2025 |
221 | 213,462 | ||||||||||
|
|
|
|||||||||||
| 9,450,274 | ||||||||||||
|
|
|
|||||||||||
| Insurance0.7% | ||||||||||||
|
Elevance Health, Inc. |
33 | 32,900 | ||||||||||
|
Guardian Life Insurance Co. of America (The) |
868 | 711,456 | ||||||||||
|
Massachusetts Mutual Life Insurance Co. |
11 | 7,340 | ||||||||||
|
MetLife Capital Trust IV |
970 | 1,039,074 | ||||||||||
|
MetLife, Inc. |
25 | 32,614 | ||||||||||
|
2022 Annual Report |
13 | |
Table of Contents
Schedule of Investments (continued)
| Principal Amount (000) | U.S. $ Value | |||||||||||
|
Nationwide Mutual Insurance Co. |
U.S.$ | 377 | $ | 483,680 | ||||||||
|
Prudential Financial, Inc. |
462 | 441,584 | ||||||||||
|
5.375%, 05/15/2045 |
139 | 132,036 | ||||||||||
|
5.625%, 06/15/2043 |
289 | 284,159 | ||||||||||
|
Swiss Re Finance Luxembourg SA |
1,400 | 1,232,504 | ||||||||||
|
Voya Financial, Inc. |
742 | 728,763 | ||||||||||
|
|
|
|||||||||||
| 5,126,110 | ||||||||||||
|
|
|
|||||||||||
| REITs0.8% | ||||||||||||
|
American Tower Corp. |
845 | 774,468 | ||||||||||
|
4.05%, 03/15/2032 |
415 | 357,290 | ||||||||||
|
Digital Realty Trust LP |
1,584 | 1,387,473 | ||||||||||
|
GLP Capital LP/GLP Financing II, Inc. |
1,181 | 886,104 | ||||||||||
|
Host Hotels & Resorts LP |
480 | 352,277 | ||||||||||
|
Vornado Realty LP |
2,003 | 1,530,673 | ||||||||||
|
|
|
|||||||||||
| 5,288,285 | ||||||||||||
|
|
|
|||||||||||
| 73,087,965 | ||||||||||||
|
|
|
|||||||||||
| Utility0.4% |
|
|||||||||||
| Electric0.3% |
|
|||||||||||
|
AES Panama Generation Holdings SRL |
487 | 383,512 | ||||||||||
|
Chile Electricity Pec SpA |
1,040 | 734,500 | ||||||||||
|
Duke Energy Carolinas NC Storm Funding LLC |
920 | 675,216 | ||||||||||
|
Engie Energia Chile SA |
981 | 740,655 | ||||||||||
|
|
|
|||||||||||
| 2,533,883 | ||||||||||||
|
|
|
|||||||||||
| Other Utility0.1% | ||||||||||||
|
American Water Capital Corp. |
438 | 390,000 | ||||||||||
|
|
|
|||||||||||
| 2,923,883 | ||||||||||||
|
|
|
|||||||||||
| Total CorporatesInvestment Grade (cost $196,414,197) |
|
164,081,859 | ||||||||||
|
|
|
|||||||||||
| MORTGAGE PASS-THROUGHS 17.2% |
|
|||||||||||
| Agency Fixed Rate 30-Year16.7% |
|
|||||||||||
|
Federal Home Loan Mortgage Corp. |
492 | 448,362 | ||||||||||
| Principal Amount (000) | U.S. $ Value | |||||||||||
|
3.50%, 11/01/2049 |
U.S.$ | 651 | $ | 592,368 | ||||||||
|
Series 2020 |
1,439 | 1,313,152 | ||||||||||
|
Series 2022 |
6,545 | 5,318,942 | ||||||||||
|
2.50%, 04/01/2052 |
7,637 | 6,435,846 | ||||||||||
|
3.00%, 03/01/2052 |
4,200 | 3,672,742 | ||||||||||
|
Federal Home Loan Mortgage Corp. Gold |
19 | 19,154 | ||||||||||
|
Series 2007 |
147 | 149,823 | ||||||||||
|
Series 2016 |
1,041 | 1,005,774 | ||||||||||
|
Series 2017 |
673 | 648,676 | ||||||||||
|
Series 2018 |
329 | 318,285 | ||||||||||
|
4.50%, 10/01/2048 |
669 | 647,841 | ||||||||||
|
4.50%, 11/01/2048 |
999 | 967,017 | ||||||||||
|
5.00%, 11/01/2048 |
369 | 365,458 | ||||||||||
|
Federal National Mortgage Association |
117 | 119,530 | ||||||||||
|
5.50%, 07/01/2033 |
221 | 225,537 | ||||||||||
|
Series 2004 |
2 | 2,351 | ||||||||||
|
5.50%, 04/01/2034 |
54 | 54,743 | ||||||||||
|
5.50%, 05/01/2034 |
45 | 45,887 | ||||||||||
|
5.50%, 11/01/2034 |
206 | 210,374 | ||||||||||
|
Series 2005 |
322 | 328,641 | ||||||||||
|
Series 2006 |
62 | 63,870 | ||||||||||
|
Series 2007 |
3 | 3,058 | ||||||||||
|
5.50%, 09/01/2036 |
2 | 1,889 | ||||||||||
|
5.50%, 08/01/2037 |
79 | 81,049 | ||||||||||
|
Series 2008 |
0 | ** | 456 | |||||||||
|
Series 2009 |
11 | 11,513 | ||||||||||
|
Series 2010 |
435 | 419,505 | ||||||||||
|
5.00%, 06/01/2040 |
11 | 10,613 | ||||||||||
|
Series 2012 |
376 | 352,959 | ||||||||||
|
3.50%, 11/01/2042 |
3,906 | 3,602,953 | ||||||||||
|
3.50%, 01/01/2043 |
661 | 609,925 | ||||||||||
|
Series 2013 |
2,263 | 2,087,470 | ||||||||||
|
4.00%, 10/01/2043 |
1,484 | 1,405,670 | ||||||||||
|
Series 2015 |
539 | 479,676 | ||||||||||
|
3.00%, 08/01/2045 |
830 | 738,398 | ||||||||||
| 14 |
Sanford C. Bernstein Fund II, Inc. |
|
Table of Contents
| Principal Amount (000) | U.S. $ Value | |||||||||||
|
Series 2018 |
U.S.$ | 1,441 | $ | 1,394,106 | ||||||||
|
Series 2019 |
1,916 | 1,744,994 | ||||||||||
|
3.50%, 09/01/2049 |
682 | 621,671 | ||||||||||
|
3.50%, 11/01/2049 |
1,307 | 1,189,644 | ||||||||||
|
Series 2020 |
1,341 | 1,221,917 | ||||||||||
|
Series 2021 |
6,779 | 5,498,308 | ||||||||||
|
2.50%, 01/01/2052 |
2,154 | 1,817,768 | ||||||||||
|
Series 2022 |
4,715 | 3,970,415 | ||||||||||
|
2.50%, 04/01/2052 |
5,001 | 4,211,488 | ||||||||||
|
2.50%, 05/01/2052 |
6,370 | 5,364,484 | ||||||||||
|
3.00%, 02/01/2052 |
5,145 | 4,500,178 | ||||||||||
|
3.00%, 03/01/2052 |
6,535 | 5,714,324 | ||||||||||
|
Government National Mortgage Association |
179 | 160,672 | ||||||||||
|
3.00%, 05/20/2046 |
518 | 465,282 | ||||||||||
|
Series 2022 |
1,480 | 1,306,541 | ||||||||||
|
4.00%, 10/01/2052, TBA |
3,275 | 3,055,173 | ||||||||||
|
4.50%, 10/01/2052, TBA |
7,442 | 7,114,132 | ||||||||||
|
Uniform Mortgage-Backed Security |
13,171 | 10,657,398 | ||||||||||
|
2.50%, 10/01/2052, TBA |
18,727 | 15,714,586 | ||||||||||
|
3.00%, 10/01/2052, TBA |
5,384 | 4,680,934 | ||||||||||
|
4.00%, 10/01/2052, TBA |
5,776 | 5,353,393 | ||||||||||
|
|
|
|||||||||||
| 118,516,915 | ||||||||||||
|
|
|
|||||||||||
| Agency Fixed Rate 15-Year0.5% |
|
|||||||||||
|
Federal National Mortgage Association |
48 | 44,049 | ||||||||||
|
2.50%, 11/01/2031 |
2,631 | 2,411,923 | ||||||||||
|
2.50%, 12/01/2031 |
13 | 11,576 | ||||||||||
|
Series 2017 |
709 | 649,376 | ||||||||||
|
2.50%, 02/01/2032 |
631 | 577,573 | ||||||||||
|
|
|
|||||||||||
| 3,694,497 | ||||||||||||
|
|
|
|||||||||||
| Other Agency Fixed Rate Programs0.0% |
|
|||||||||||
|
Federal National Mortgage Association |
20 | 20,018 | ||||||||||
|
|
|
|||||||||||
| Agency ARMs0.0% |
|
|||||||||||
|
Federal Home Loan Mortgage Corp. Gold |
0 | ** | 125 | |||||||||
|
Series 2007 |
0 | ** | 370 | |||||||||
| Principal Amount (000) | U.S. $ Value | |||||||||||
|
Federal National Mortgage Association |
U.S.$ | 1 | $ | 1,006 | ||||||||
|
2.52% (LIBOR 12 Month + 1.80%), 03/01/2037(e) |
0 | ** | 456 | |||||||||
|
|
|
|||||||||||
| 1,957 | ||||||||||||
|
|
|
|||||||||||
| Total Mortgage Pass-Throughs (cost $132,994,550) |
|
122,233,387 | ||||||||||
|
|
|
|||||||||||
| COLLATERALIZED MORTGAGE OBLIGATIONS7.7% |
|
|||||||||||
| Risk Share Floating Rate6.6% |
|
|||||||||||
|
Bellemeade Re Ltd. |
226 | 225,775 | ||||||||||
|
Series 2019-3A, Class M1B |
227 | 227,010 | ||||||||||
|
Series 2019-3A, Class M1C |
300 | 296,394 | ||||||||||
|
Series 2020-3A, Class M1B |
88 | 88,164 | ||||||||||
|
Series 2021-1A, Class M1C |
1,036 | 1,002,192 | ||||||||||
|
Series 2021-2A, Class M1B |
1,892 | 1,828,527 | ||||||||||
|
Series 2021-3A, Class A2 |
1,894 | 1,780,284 | ||||||||||
|
Series 2022-1, Class M1B |
1,000 | 977,873 | ||||||||||
|
Connecticut Avenue Securities Trust |
1,550 | 1,548,233 | ||||||||||
|
Series 2022-R07, Class 1M1 |
2,096 | 2,095,698 | ||||||||||
|
Connecticut Avenue Securities Trust |
2,037 | 1,991,603 | ||||||||||
|
Series 2022-R01, Class 1M2 |
2,306 | 2,099,693 | ||||||||||
|
Series 2022-R02, Class 2M1 |
1,913 | 1,873,130 | ||||||||||
|
2022 Annual Report |
15 | |
Table of Contents
Schedule of Investments (continued)
| Principal Amount (000) | U.S. $ Value | |||||||||||
|
Series 2022-R03, Class 1M2 |
U.S.$ | 1,545 | $ | 1,467,295 | ||||||||
|
Series 2022-R05, Class 2M2 |
1,206 | 1,112,946 | ||||||||||
|
Eagle Re Ltd. |
217 | 215,466 | ||||||||||
|
Series 2020-1, Class M1A |
17 | 17,426 | ||||||||||
|
Series 2021-2, Class M1B |
650 | 631,957 | ||||||||||
|
Federal Home Loan Mortgage Corp. |
1,358 | 1,289,921 | ||||||||||
|
Federal Home Loan Mortgage Corp. |
315 | 318,124 | ||||||||||
|
Series 2020-DNA5, Class M2 |
655 | 655,367 | ||||||||||
|
Series 2021-DNA3, Class M2 |
779 | 741,627 | ||||||||||
|
Series 2021-DNA5, Class M2 |
652 | 636,217 | ||||||||||
|
Series 2021-DNA6, Class M2 |
2,513 | 2,280,811 | ||||||||||
|
Series 2021-DNA7, Class M2 |
2,412 | 2,161,331 | ||||||||||
|
Series 2021-HQA4, Class M2 |
1,530 | 1,300,513 | ||||||||||
|
Series 2022-DNA1, Class M1A |
952 | 924,270 | ||||||||||
|
Series 2022-DNA1, Class M1B |
1,223 | 1,110,088 | ||||||||||
|
Series 2022-DNA2, Class M1B |
1,717 | 1,594,535 | ||||||||||
|
Series 2022-DNA3, Class M1B |
711 | 671,287 | ||||||||||
| Principal Amount (000) | U.S. $ Value | |||||||||||
|
Series 2022-DNA5, Class M1B |
U.S.$ | 2,274 | $ | 2,278,701 | ||||||||
|
Series 2022-DNA6, Class M1A |
803 | 798,280 | ||||||||||
|
Series 2022-DNA7, Class M1A |
2,142 | 2,142,998 | ||||||||||
|
Series 2022-HQA1, Class M1B |
399 | 381,778 | ||||||||||
|
Federal National Mortgage Association Connecticut Avenue Securities |
123 | 126,982 | ||||||||||
|
Series 2021-R02, Class 2M2 |
1,071 | 957,119 | ||||||||||
|
Home Re Ltd. |
1,162 | 1,136,169 | ||||||||||
|
JPMorgan Madison Avenue Securities Trust |
47 | 45,203 | ||||||||||
|
Oaktown Re VII Ltd. |
1,767 | 1,734,777 | ||||||||||
|
PMT Credit Risk Transfer Trust |
||||||||||||
|
5.863% (LIBOR 1 Month + 2.75%), 05/27/2023(c)(e) |
749 | 718,827 | ||||||||||
|
Series 2019-3R, Class A |
63 | 60,637 | ||||||||||
|
Series 2020-1R, Class A |
245 | 232,759 | ||||||||||
|
Radnor Re Ltd. |
909 | 897,949 | ||||||||||
|
Series 2019-2, Class M1B |
230 | 229,221 | ||||||||||
|
Series 2020-1, Class M1A |
270 | 268,877 | ||||||||||
|
Traingle Re Ltd. |
1,225 | 1,215,981 | ||||||||||
| 16 |
Sanford C. Bernstein Fund II, Inc. |
|
Table of Contents
| Principal Amount (000) | U.S. $ Value | |||||||||||
|
Wells Fargo Credit Risk Transfer Securities Trust |
U.S.$ | 187 | $ | 172,259 | ||||||||
|
Series 2015-WF1, Class 2M2 |
48 | 44,698 | ||||||||||
|
|
|
|||||||||||
| 46,606,972 | ||||||||||||
|
|
|
|||||||||||
| Agency Fixed Rate0.6% |
|
|||||||||||
|
Federal Home Loan Mortgage Corp. REMICs |
5,454 | 1,108,447 | ||||||||||
|
Series 5015, Class BI |
3,260 | 618,417 | ||||||||||
|
Series 5034, Class BI |
4,400 | 969,783 | ||||||||||
|
Federal National Mortgage Association Grantor Trust |
291 | 261,614 | ||||||||||
|
Federal National Mortgage Association REMICs |
7,042 | 1,331,400 | ||||||||||
|
|
|
|||||||||||
| 4,289,661 | ||||||||||||
|
|
|
|||||||||||
| Agency Floating Rate0.3% |
|
|||||||||||
|
Federal Home Loan Mortgage Corp. REMICs |
1,387 | 131,884 | ||||||||||
|
Series 4693, Class SL |
1,513 | 163,856 | ||||||||||
|
Series 4954, Class SL |
2,144 | 214,517 | ||||||||||
|
Series 4981, Class HS |
4,662 | 458,827 | ||||||||||
|
Federal National Mortgage Association REMICs |
814 | 95,005 | ||||||||||
|
Series 2016-106, Class ES |
1,390 | 142,281 | ||||||||||
|
Series 2017-73, Class SA |
1,787 | 209,237 | ||||||||||
|
Series 2017-97, Class LS |
1,426 | 157,158 | ||||||||||
| Principal Amount (000) | U.S. $ Value | |||||||||||
|
Series 2017-97, Class SW |
U.S.$ | 1,286 | $ | 136,283 | ||||||||
|
Government National Mortgage Association |
1,799 | 194,802 | ||||||||||
|
Series 2017-65, Class ST |
1,605 | 181,083 | ||||||||||
|
Series 2017-134, Class SE |
893 | 84,828 | ||||||||||
|
|
|
|||||||||||
| 2,169,761 | ||||||||||||
|
|
|
|||||||||||
| Non-Agency Floating Rate0.1% |
|
|||||||||||
|
Deutsche Alt-A Securities Mortgage Loan Trust |
863 | 319,872 | ||||||||||
|
HomeBanc Mortgage Trust |
154 | 129,816 | ||||||||||
|
JPMorgan Chase Bank, NA |
198 | 193,447 | ||||||||||
|
|
|
|||||||||||
| 643,135 | ||||||||||||
|
|
|
|||||||||||
| Non-Agency Fixed Rate0.1% |
|
|||||||||||
|
Alternative Loan Trust |
64 | 46,030 | ||||||||||
|
Series 2006-24CB, Class A16 |
379 | 218,877 | ||||||||||
|
Series 2006-28CB, Class A14 |
290 | 164,907 | ||||||||||
|
Series 2006-J1, Class 1A13 |
168 | 121,962 | ||||||||||
|
CHL Mortgage Pass-Through Trust |
74 | 35,213 | ||||||||||
|
|
|
|||||||||||
| 586,989 | ||||||||||||
|
|
|
|||||||||||
| Total Collateralized Mortgage Obligations (cost $56,788,872) |
|
54,296,518 | ||||||||||
|
|
|
|||||||||||
| ASSET-BACKED SECURITIES5.2% |
|
|||||||||||
| Other ABSFixed Rate2.7% |
|
|||||||||||
|
AB Issuer LLC |
2,090 | 1,714,489 | ||||||||||
|
Affirm Asset Securitization Trust |
427 | 414,290 | ||||||||||
|
2022 Annual Report |
17 | |
Table of Contents
Schedule of Investments (continued)
| Principal Amount (000) | U.S. $ Value | |||||||||||
|
Series 2021-Z2, Class A |
U.S.$ | 450 | $ | 433,812 | ||||||||
|
Series 2022-X1, Class A |
1,168 | 1,138,828 | ||||||||||
|
Atalaya Equipment Leasing Trust |
509 | 474,682 | ||||||||||
|
BHG Securitization Trust |
267 | 249,801 | ||||||||||
|
Cajun Global LLC |
440 | 374,068 | ||||||||||
|
College Ave Student Loans LLC |
637 | 539,331 | ||||||||||
|
Conns Receivables Funding LLC |
507 | 504,304 | ||||||||||
|
Dext ABS LLC |
186 | 168,830 | ||||||||||
|
Diamond Infrastructure Funding LLC |
935 | 761,904 | ||||||||||
|
Diamond Issuer |
1,941 | 1,639,607 | ||||||||||
|
Dominos Pizza Master Issuer LLC |
1,055 | 868,487 | ||||||||||
|
FREED ABS Trust |
1,760 | 1,696,120 | ||||||||||
|
GCI Funding I LLC |
658 | 561,473 | ||||||||||
|
Hardees Funding LLC |
716,083 | |||||||||||
|
Series 2020-1A, Class A2 |
481 | 412,890 | ||||||||||
|
MVW LLC |
881 | 785,410 | ||||||||||
|
Neighborly Issuer |
2,003 | 1,611,333 | ||||||||||
|
Neighborly Issuer LLC |
769 | 635,816 | ||||||||||
|
Nelnet Student Loan Trust |
620 | 493,140 | ||||||||||
|
Series 2021-CA, Class B |
907 | 707,037 | ||||||||||
|
Series 2021-DA, Class B |
798 | 643,202 | ||||||||||
| Principal Amount (000) | U.S. $ Value | |||||||||||
|
Upstart Securitization Trust |
U.S.$ | 30 | $ | 30,301 | ||||||||
|
Series 2021-3, Class B |
1,360 | 1,252,550 | ||||||||||
|
|
|
|||||||||||
| 18,827,788 | ||||||||||||
|
|
|
|||||||||||
| AutosFixed Rate2.1% |
|
|||||||||||
|
ACM Auto Trust |
1,183 | 1,179,400 | ||||||||||
|
Avis Budget Rental Car Funding AESOP LLC |
1,527 | 1,520,328 | ||||||||||
|
Series 2018-1A, Class A |
1,700 | 1,685,575 | ||||||||||
|
Series 2018-2A, Class A |
1,680 | 1,650,582 | ||||||||||
|
Carvana Auto Receivables Trust |
905 | 869,739 | ||||||||||
|
Series 2021-N4, Class D |
793 | 728,339 | ||||||||||
|
Series 2021-P4, Class D |
||||||||||||
|
2.61%, 09/11/2028 |
989 | 811,717 | ||||||||||
|
CPS Auto Receivables Trust |
1,350 | 1,220,354 | ||||||||||
|
Series 2022-A, Class C |
1,373 | 1,271,462 | ||||||||||
|
FHF Trust |
588 | 558,311 | ||||||||||
|
Ford Credit Auto Owner Trust |
1,390 | 1,197,950 | ||||||||||
|
LAD Auto Receivables Trust |
853 | 822,486 | ||||||||||
|
Santander Bank Auto Credit-Linked Notes |
1,469 | 1,441,254 | ||||||||||
|
|
|
|||||||||||
| 14,957,497 | ||||||||||||
|
|
|
|||||||||||
| Credit CardsFixed Rate0.4% | ||||||||||||
|
Brex Commercial Charge Card Master Trust |
1,021 | 1,001,445 | ||||||||||
|
Series 2022-1, Class A |
1,888 | 1,828,513 | ||||||||||
|
Mission Lane Credit Card Master Trust |
400 | 385,932 | ||||||||||
|
|
|
|||||||||||
| 3,215,890 | ||||||||||||
|
|
|
|||||||||||
| 18 |
Sanford C. Bernstein Fund II, Inc. |
|
Table of Contents
| Principal Amount (000) | U.S. $ Value | |||||||||||
| Home Equity LoansFloating Rate0.0% |
|
|||||||||||
|
Wells Fargo Home Equity Trust Mortgage Pass-Through Certificates |
U.S.$ | 40 | $ | 37,370 | ||||||||
|
|
|
|||||||||||
| Total Asset-Backed Securities (cost $40,870,267) |
37,038,545 | |||||||||||
|
|
|
|||||||||||
| COMMERCIAL MORTGAGE-BACKED SECURITIES3.5% |
|
|||||||||||
| Non-Agency Floating Rate CMBS2.0% |
|
|||||||||||
|
AREIT Trust |
3,069 | 2,950,847 | ||||||||||
|
Ashford Hospitality Trust |
792 | 767,063 | ||||||||||
|
BAMLL Commercial Mortgage Securities Trust |
2,435 | 2,293,579 | ||||||||||
|
BBCMS Mortgage Trust |
1,998 | 1,967,874 | ||||||||||
|
BFLD Trust |
2,976 | 2,869,955 | ||||||||||
|
BX Commercial Mortgage Trust |
207 | 195,972 | ||||||||||
|
Series 2019-IMC, Class E |
839 | 791,598 | ||||||||||
|
CLNY Trust |
1,450 | 1,351,907 | ||||||||||
|
Federal Home Loan Mortgage Corp. Multifamily Structured Credit Risk |
189 | 181,942 | ||||||||||
|
Natixis Commercial Mortgage Securities Trust |
666 | 655,295 | ||||||||||
|
|
|
|||||||||||
| 14,026,032 | ||||||||||||
|
|
|
|||||||||||
| Principal Amount (000) | U.S. $ Value | |||||||||||
| Non-Agency Fixed Rate CMBS1.5% |
|
|||||||||||
|
BAMLL Commercial Mortgage Securities Trust |
U.S.$ | 740 | $ | 628,011 | ||||||||
|
Banc of America Commercial Mortgage Trust |
211 | 197,750 | ||||||||||
|
Citigroup Commercial Mortgage Trust |
1,140 | 1,122,519 | ||||||||||
|
Commercial Mortgage Trust |
889 | 532,599 | ||||||||||
|
Series 2013-SFS, Class A1 |
86 | 84,690 | ||||||||||
|
Series 2015-LC21, Class XA |
2,095 | 29,563 | ||||||||||
|
GS Mortgage Securities Trust |
28 | 11,704 | ||||||||||
|
Series 2013-G1, Class A2 |
798 | 791,854 | ||||||||||
|
GSF |
1,184 | 1,096,778 | ||||||||||
|
Series 2021-1, Class A2 |
1,801 | 1,697,612 | ||||||||||
|
Series 2021-1, Class AS |
59 | 54,422 | ||||||||||
|
HFX Funding Issuer |
1,690 | 1,551,525 | ||||||||||
|
JPMBB Commercial Mortgage Securities Trust |
472 | 264,198 | ||||||||||
|
Series 2014-C22, Class XA |
5,187 | 58,816 | ||||||||||
|
JPMorgan Chase Commercial Mortgage Securities Trust |
712 | 551,841 | ||||||||||
|
LB-UBS Commercial Mortgage Trust |
147 | 65,093 | ||||||||||
|
LSTAR Commercial Mortgage Trust |
321 | 318,187 | ||||||||||
|
Morgan Stanley Bank of America Merrill Lynch Trust |
603 | 516,812 | ||||||||||
|
Series 2015-C25, Class XA |
1,946 | 42,487 | ||||||||||
|
2022 Annual Report |
19 | |
Table of Contents
Schedule of Investments (continued)
| Principal Amount (000) | U.S. $ Value | |||||||||||
|
Wells Fargo Commercial Mortgage Trust |
U.S.$ | 1,030 | $ | 917,863 | ||||||||
|
WF-RBS Commercial Mortgage Trust |
356 | 339,343 | ||||||||||
|
|
|
|||||||||||
| 10,873,667 | ||||||||||||
|
|
|
|||||||||||
| Total Commercial Mortgage-Backed Securities (cost $27,029,085) |
|
24,899,699 | ||||||||||
|
|
|
|||||||||||
| COLLATERALIZED LOAN OBLIGATIONS2.9% |
|
|||||||||||
| CLOFloating Rate2.9% |
|
|||||||||||
|
Balboa Bay Loan Funding Ltd. |
1,472 | 1,409,977 | ||||||||||
|
Dryden 78 CLO Ltd. |
1,260 | 1,153,084 | ||||||||||
|
Elevation CLO Ltd. |
1,080 | 959,644 | ||||||||||
|
Elmwood CLO IX Ltd. |
1,500 | 1,435,399 | ||||||||||
|
Flatiron CLO 21 Ltd. |
1,130 | 1,078,863 | ||||||||||
|
Goldentree Loan Management US CLO 7 Ltd. |
1,491 | 1,415,039 | ||||||||||
|
Neuberger Berman Loan Advisers CLO 43 Ltd. |
1,729 | 1,656,764 | ||||||||||
|
New Mountain CLO 3 Ltd. |
250 | 225,170 | ||||||||||
|
OCP CLO Ltd. |
1,954 | 1,888,318 | ||||||||||
|
Pikes Peak CLO 8 |
1,907 | 1,824,979 | ||||||||||
| Principal Amount (000) | U.S. $ Value | |||||||||||
|
Rad CLO 7 Ltd. |
U.S.$ | 570 | $ | 524,104 | ||||||||
|
Rad CLO 11 Ltd. |
950 | 833,700 | ||||||||||
|
Regatta XX Funding Ltd. |
2,924 | 2,770,161 | ||||||||||
|
Rockford Tower CLO Ltd. |
1,883 | 1,606,267 | ||||||||||
|
Series 2021-2A, Class A1 |
1,310 | 1,244,401 | ||||||||||
|
Voya CLO Ltd. |
480 | 410,316 | ||||||||||
|
|
|
|||||||||||
| Total Collateralized Loan Obligations (cost $21,888,018) |
|
20,436,186 | ||||||||||
|
|
|
|||||||||||
| CORPORATESNON-INVESTMENT GRADE2.1% |
|
|||||||||||
| Industrial1.5% |
|
|||||||||||
| Capital Goods0.0% | ||||||||||||
|
TK Elevator Midco GmbH |
EUR | 331 | 272,626 | |||||||||
|
|
|
|||||||||||
| CommunicationsMedia0.5% |
|
|||||||||||
|
Altice Financing SA |
540 | 398,339 | ||||||||||
|
CCO Holdings LLC/CCO Holdings Capital Corp. |
U.S.$ | 348 | 275,282 | |||||||||
|
4.50%, 06/01/2033(c) |
1,243 | 921,958 | ||||||||||
|
4.75%, 02/01/2032(c) |
260 | 202,893 | ||||||||||
|
DISH DBS Corp. |
996 | 750,924 | ||||||||||
|
Summer BC Holdco B SARL |
EUR | 540 | 451,775 | |||||||||
|
VZ Vendor Financing II BV |
540 | 376,878 | ||||||||||
|
|
|
|||||||||||
| 3,378,049 | ||||||||||||
|
|
|
|||||||||||
| CommunicationsTelecommunications0.1% |
|
|||||||||||
|
Altice France SA/France |
259 | 192,903 | ||||||||||
|
Lorca Telecom Bondco SA |
540 | 460,502 | ||||||||||
|
|
|
|||||||||||
| 653,405 | ||||||||||||
|
|
|
|||||||||||
| 20 |
Sanford C. Bernstein Fund II, Inc. |
|
Table of Contents
| Principal Amount (000) | U.S. $ Value | |||||||||||
| Consumer CyclicalAutomotive0.2% |
|
|||||||||||
|
Adient Global Holdings Ltd. |
EUR | 540 | $ | 488,805 | ||||||||
|
Ford Motor Co. |
U.S.$ | 759 | 669,081 | |||||||||
|
ZF Finance GmbH |
EUR | 400 | 305,023 | |||||||||
|
|
|
|||||||||||
| 1,462,909 | ||||||||||||
|
|
|
|||||||||||
| Consumer CyclicalEntertainment0.3% |
|
|||||||||||
|
Carnival Corp. |
U.S.$ | 1,545 | 1,247,062 | |||||||||
|
Royal Caribbean Cruises Ltd. |
993 | 965,961 | ||||||||||
|
|
|
|||||||||||
| 2,213,023 | ||||||||||||
|
|
|
|||||||||||
| Consumer CyclicalOther0.0% | ||||||||||||
|
NH Hotel Group SA |
EUR | 190 | 162,097 | |||||||||
|
|
|
|||||||||||
| Consumer Non-Cyclical0.2% | ||||||||||||
|
Albertsons Cos., Inc./Safeway, Inc./New Albertsons LP/Albertsons LLC |
U.S.$ | 959 | 774,393 | |||||||||
|
IQVIA, Inc. |
EUR | 310 | 232,917 | |||||||||
|
Nobel Bidco BV |
540 | 355,111 | ||||||||||
|
Organon & Co./Organon Foreign Debt Co-Issuer BV |
320 | 250,717 | ||||||||||
|
|
|
|||||||||||
| 1,613,138 | ||||||||||||
|
|
|
|||||||||||
| Services0.1% | ||||||||||||
|
APCOA Parking Holdings GmbH |
540 | 419,741 | ||||||||||
|
|
|
|||||||||||
| Technology0.1% | ||||||||||||
|
Playtech PLC |
310 | 275,272 | ||||||||||
|
|
|
|||||||||||
| TransportationAirlines0.0% | ||||||||||||
|
Deutsche Lufthansa AG |
200 | 164,448 | ||||||||||
|
|
|
|||||||||||
| 10,614,708 | ||||||||||||
|
|
|
|||||||||||
| Financial Institutions0.5% |
|
|||||||||||
| Banking0.5% | ||||||||||||
|
Credit Suisse Group AG |
U.S.$ | 355 | 259,903 | |||||||||
|
7.50%, 07/17/2023(c)(d) |
1,617 | 1,390,604 | ||||||||||
|
7.50%, 07/17/2023(c) |
749 | 644,133 | ||||||||||
|
7.50%, 12/11/2023(c)(d) |
553 | 508,732 | ||||||||||
|
Intesa Sanpaolo SpA |
757 | 706,591 | ||||||||||
|
|
|
|||||||||||
| 3,509,963 | ||||||||||||
|
|
|
|||||||||||
| Principal Amount (000) | U.S. $ Value | |||||||||||
| Utility0.1% |
|
|||||||||||
| Electric0.1% | ||||||||||||
|
Vistra Corp. |
U.S.$ | 648 | $ | 566,579 | ||||||||
|
|
|
|||||||||||
| Total CorporatesNon-Investment Grade (cost $18,744,939) |
|
14,691,250 | ||||||||||
|
|
|
|||||||||||
| LOCAL GOVERNMENTSUS MUNICIPAL BONDS0.9% |
|
|||||||||||
| United States0.9% | ||||||||||||
|
Port Authority of New York & New Jersey |
1,000 | 974,841 | ||||||||||
|
State Board of Administration Finance Corp. |
1,634 | 1,397,363 | ||||||||||
|
State of California |
2,040 | 2,530,643 | ||||||||||
|
Tobacco Settlement Finance Authority/WV |
540 | 512,295 | ||||||||||
|
University of California |
2,070 | 1,380,215 | ||||||||||
|
|
|
|||||||||||
| Total Local GovernmentsUS Municipal Bonds (cost $7,355,107) |
|
6,795,357 | ||||||||||
|
|
|
|||||||||||
| EMERGING MARKETSCORPORATE BONDS0.5% |
|
|||||||||||
| Industrial0.5% | ||||||||||||
| Basic0.0% | ||||||||||||
|
CSN Resources SA |
293 | 199,299 | ||||||||||
|
Volcan Cia Minera SAA |
189 | 154,779 | ||||||||||
|
|
|
|||||||||||
| 354,078 | ||||||||||||
|
|
|
|||||||||||
| Capital Goods0.2% | ||||||||||||
|
Embraer Netherlands Finance BV |
1,025 | 934,236 | ||||||||||
|
6.95%, 01/17/2028(c) |
537 | 504,042 | ||||||||||
|
Odebrecht Holdco Finance Ltd. |
417 | 833 | ||||||||||
|
|
|
|||||||||||
| 1,439,111 | ||||||||||||
|
|
|
|||||||||||
| CommunicationsMedia0.1% |
|
|||||||||||
|
Globo Comunicacao e Participacoes SA |
|
645 | 485,362 | |||||||||
|
|
|
|||||||||||
| Consumer CyclicalOther0.1% |
|
|||||||||||
|
Wynn Macau Ltd. |
730 | 489,100 | ||||||||||
|
|
|
|||||||||||
|
2022 Annual Report |
21 | |
Table of Contents
Schedule of Investments (continued)
| Principal Amount (000) | U.S. $ Value | |||||||||||
| Consumer Non-Cyclical0.1% |
|
|||||||||||
|
Natura & Co. Luxembourg Holdings SARL |
U.S.$ | 564 | $ | 459,801 | ||||||||
|
|
|
|||||||||||
| 3,227,452 | ||||||||||||
|
|
|
|||||||||||
| Utility0.0% |
|
|||||||||||
| Electric0.0% |
|
|||||||||||
|
Terraform Global Operating LP |
117 | 110,187 | ||||||||||
|
|
|
|||||||||||
| Financial Institutions0.0% |
|
|||||||||||
| Other Finance0.0% |
|
|||||||||||
|
OEC Finance Ltd. |
381 | 8,404 | ||||||||||
|
|
|
|||||||||||
| Total Emerging MarketsCorporate Bonds (cost $4,827,207) |
|
3,346,043 | ||||||||||
|
|
|
|||||||||||
| Shares | ||||||||||||
| COMMON STOCKS0.3% |
|
|||||||||||
| Financials0.3% |
|
|||||||||||
| Insurance0.3% |
|
|||||||||||
|
Mt Logan Re Ltd. (Preference Shares)(i)(k)(l) |
2,267 | 1,938,502 | ||||||||||
|
Mt Logan Re Ltd. (Special Investment)(i)(k)(l) |
359 | 300,791 | ||||||||||
|
|
|
|||||||||||
| Total Common Stocks (cost $2,266,850) |
2,239,293 | |||||||||||
|
|
|
|||||||||||
| Principal Amount (000) | ||||||||||||
| AGENCIES0.3% |
|
|||||||||||
| Agency Debentures0.3% |
|
|||||||||||
|
Federal Home Loan Banks |
U.S.$ | 1,465 | 1,429,327 | |||||||||
|
Federal National Mortgage Association |
355 | 399,952 | ||||||||||
|
6.625%, 11/15/2030 |
260 | 303,645 | ||||||||||
|
|
|
|||||||||||
| Total Agencies (cost $2,229,266) |
2,132,924 | |||||||||||
|
|
|
|||||||||||
| EMERGING MARKETSSOVEREIGNS0.3% |
|
|||||||||||
| Dominican Republic0.2% |
|
|||||||||||
|
Dominican Republic International Bond |
1,919 | 1,431,814 | ||||||||||
|
|
|
|||||||||||
| Principal Amount (000) | U.S. $ Value | |||||||||||
| Egypt0.1% | ||||||||||||
|
Egypt Government International Bond |
U.S.$ | 1,070 | $ | 616,454 | ||||||||
|
|
|
|||||||||||
| Total Emerging MarketsSovereigns (cost $2,950,147) |
|
2,048,268 | ||||||||||
|
|
|
|||||||||||
| QUASI-SOVEREIGNS0.3% |
|
|||||||||||
| Quasi-Sovereign Bonds0.3% |
|
|||||||||||
| Indonesia0.1% | ||||||||||||
|
Perusahaan Perseroan Persero PT Perusahaan Listrik Negara |
447 | 426,139 | ||||||||||
|
|
|
|||||||||||
| Mexico0.2% | ||||||||||||
|
Comision Federal de Electricidad |
1,685 | 1,212,463 | ||||||||||
|
4.688%, 05/15/2029(c) |
478 | 398,323 | ||||||||||
|
|
|
|||||||||||
| 1,610,786 | ||||||||||||
|
|
|
|||||||||||
| Total Quasi-Sovereigns (cost $2,608,839) |
|
2,036,925 | ||||||||||
|
|
|
|||||||||||
| GOVERNMENTSSOVEREIGN BONDS0.1% |
|
|||||||||||
| Colombia0.1% | ||||||||||||
|
Colombia Government International Bond |
696 | 482,980 | ||||||||||
|
|
|
|||||||||||
| SHORT-TERM INVESTMENTS2.0% |
|
|||||||||||
| U.S. Treasury Bills1.0% |
|
|||||||||||
|
U.S. Treasury Bill |
7,454 | 7,323,429 | ||||||||||
|
|
|
|||||||||||
| Shares | ||||||||||||
| Investment Companies1.0% |
|
|||||||||||
|
AB Fixed Income Shares, Inc.Government Money Market PortfolioClass AB, 2.58%(m)(n)(o) |
7,113,855 | 7,113,855 | ||||||||||
|
|
|
|||||||||||
| Total Short-Term Investments (cost $14,432,534) |
14,437,284 | |||||||||||
|
|
|
|||||||||||
| Total Investments107.0% (cost $857,544,873) |
757,917,907 | |||||||||||
|
Other assets less liabilities(7.0)% |
|
(49,427,619 | ) | |||||||||
|
|
|
|||||||||||
| Net Assets100.0% | $ | 708,490,288 | ||||||||||
|
|
|
|||||||||||
| 22 |
Sanford C. Bernstein Fund II, Inc. |
|
Table of Contents
| FUTURES (see Note 3) |
|
|||||||||||||
| Description | Number of Contracts |
Expiration Month |
Current Notional |
Value and Unrealized Appreciation/ (Depreciation) |
||||||||||
| Purchased Contracts |
|
|||||||||||||
|
U.S. 10 Yr Ultra Futures |
2 | December 2022 | $ | 236,969 | $ | (7,300 | ) | |||||||
|
U.S. Long Bond (CBT) Futures |
45 | December 2022 | 5,688,281 | 13,279 | ||||||||||
|
U.S. T-Note 2 Yr (CBT) Futures |
215 | December 2022 | 44,158,985 | (693,985 | ) | |||||||||
|
U.S. T-Note 5 Yr (CBT) Futures |
519 | December 2022 | 55,796,555 | (1,767,122 | ) | |||||||||
|
U.S. Ultra Bond (CBT) Futures |
35 | December 2022 | 4,795,000 | (460,521 | ) | |||||||||
| Sold Contracts |
|
|||||||||||||
|
10 Yr Japan Bond (OSE) Futures |
22 | December 2022 | 22,542,666 | 61,078 | ||||||||||
|
Long Gilt Futures |
186 | December 2022 | 20,020,187 | (248,469 | ) | |||||||||
|
|
|
|||||||||||||
| $ | (3,103,040 | ) | ||||||||||||
|
|
|
|||||||||||||
| FORWARD CURRENCY EXCHANGE CONTRACTS (see Note 3) |
|
|||||||||||||||||||
| Counterparty | Contracts to Deliver (000) |
In Exchange For (000) |
Settlement Date |
Unrealized Appreciation/ (Depreciation) |
||||||||||||||||
|
Bank of America, NA |
EUR | 4,671 | USD | 4,512 | 12/08/2022 | $ | (86,838 | ) | ||||||||||||
|
State Street Bank & Trust Co. |
JPY | 445 | USD | 3 | 12/02/2022 | 50 | ||||||||||||||
|
|
|
|||||||||||||||||||
| $ | (86,788) | |||||||||||||||||||
|
|
|
|||||||||||||||||||
| CENTRALLY CLEARED CREDIT DEFAULT SWAPS (see Note 3) |
|
|||||||||||||||||||||||||||||||
| Description | Fixed Rate (Pay) Receive |
Payment Frequency |
Implied 2022 |
Notional |
Market Value |
Upfront Paid/ (Received) |
Unrealized Appreciation/ (Depreciation) |
|||||||||||||||||||||||||
| Buy Contracts | ||||||||||||||||||||||||||||||||
|
CDX-NAHY Series 39, |
5.00% | Quarterly | 6.06% | USD | 14,453 | $ | 572,115 | $ | 569,942 | $ | 2,173 | |||||||||||||||||||||
* Termination date
| CENTRALLY CLEARED INTEREST RATE SWAPS (see Note 3) | ||||||||||||||||||||||||||||
|
Rate Type |
Payment |
Market |
Upfront Premiums Paid/ (Received) |
Unrealized |
||||||||||||||||||||||||
| Notional Amount (000) |
Termination Date |
Payments made by the Fund |
Payments received by the Fund |
|||||||||||||||||||||||||
| USD | 4,950 | 12/13/2029 | 1.764% | 3 Month LIBOR | Semi-Annual/Quarterly | $ | 639,975 | $ | | $ | 639,975 | |||||||||||||||||
|
2022 Annual Report |
23 | |
Table of Contents
Schedule of Investments (continued)
| CREDIT DEFAULT SWAPS (see Note 3) |
|
|||||||||||||||||||||||||||||||
| Swap Counterparty & Referenced Obligation | Fixed Rate (Pay) Receive |
Payment Frequency |
Implied Credit Spread at September 30, 2022 |
Notional |
Market Value |
Upfront Premiums Paid/ (Received) |
Unrealized Appreciation/ (Depreciation) |
|||||||||||||||||||||||||
| Sale Contracts | ||||||||||||||||||||||||||||||||
| Citigroup Global Markets, Inc. |
|
|||||||||||||||||||||||||||||||
|
CDX-CMBX.NA.BBB- |
3.00 | % | Monthly | 7.50 | % | USD | 5 | $ | (1,127 | ) | $ | (758 | ) | $ | (369 | ) | ||||||||||||||||
|
CDX-CMBX.NA.BBB- |
3.00 | Monthly | 7.50 | USD | 7 | (1,609 | ) | (865 | ) | (744 | ) | |||||||||||||||||||||
|
CDX-CMBX.NA.BBB- |
3.00 | Monthly | 7.50 | USD | 18 | (4,025 | ) | (1,709 | ) | (2,316 | ) | |||||||||||||||||||||
|
CDX-CMBX.NA.BBB- |
3.00 | Monthly | 7.50 | USD | 25 | (5,635 | ) | (2,836 | ) | (2,799 | ) | |||||||||||||||||||||
|
CDX-CMBX.NA.BBB- |
3.00 | Monthly | 7.50 | USD | 30 | (6,762 | ) | (3,832 | ) | (2,930 | ) | |||||||||||||||||||||
|
CDX-CMBX.NA.BBB- |
3.00 | Monthly | 7.50 | USD | 35 | (7,889 | ) | (4,907 | ) | (2,982 | ) | |||||||||||||||||||||
|
CDX-CMBX.NA.BBB- |
3.00 | Monthly | 7.50 | USD | 32 | (7,083 | ) | (3,921 | ) | (3,162 | ) | |||||||||||||||||||||
|
CDX-CMBX.NA.BBB- |
3.00 | Monthly | 7.50 | USD | 31 | (6,923 | ) | (3,666 | ) | (3,257 | ) | |||||||||||||||||||||
|
CDX-CMBX.NA.BBB- |
3.00 | Monthly | 7.50 | USD | 36 | (8,049 | ) | (4,403 | ) | (3,646 | ) | |||||||||||||||||||||
|
CDX-CMBX.NA.BBB- |
3.00 | Monthly | 7.50 | USD | 36 | (8,050 | ) | (4,263 | ) | (3,787 | ) | |||||||||||||||||||||
|
CDX-CMBX.NA.BBB- |
3.00 | Monthly | 7.50 | USD | 52 | (11,590 | ) | (5,538 | ) | (6,052 | ) | |||||||||||||||||||||
|
CDX-CMBX.NA.BBB- |
3.00 | Monthly | 7.50 | USD | 73 | (16,420 | ) | (7,846 | ) | (8,574 | ) | |||||||||||||||||||||
|
CDX-CMBX.NA.BBB- |
3.00 | Monthly | 7.50 | USD | 83 | (18,674 | ) | (9,399 | ) | (9,275 | ) | |||||||||||||||||||||
|
CDX-CMBX.NA.BBB- |
3.00 | Monthly | 7.50 | USD | 365 | (81,941 | ) | (42,418 | ) | (39,523 | ) | |||||||||||||||||||||
|
CDX-CMBX.NA.BBB- |
3.00 | Monthly | 7.50 | USD | 457 | (102,386 | ) | (33,845 | ) | (68,541 | ) | |||||||||||||||||||||
| Credit Suisse International |
|
|||||||||||||||||||||||||||||||
|
CDX-CMBX.NA.BBB- |
3.00 | Monthly | 7.50 | USD | 4 | (805 | ) | (420 | ) | (385 | ) | |||||||||||||||||||||
|
CDX-CMBX.NA.BBB- |
3.00 | Monthly | 7.50 | USD | 118 | (26,563 | ) | (13,755 | ) | (12,808 | ) | |||||||||||||||||||||
|
CDX-CMBX.NA.BBB- |
3.00 | Monthly | 7.50 | USD | 180 | (40,407 | ) | (13,677 | ) | (26,730 | ) | |||||||||||||||||||||
|
CDX-CMBX.NA.BBB- |
3.00 | Monthly | 7.50 | USD | 172 | (38,636 | ) | (11,149 | ) | (27,487 | ) | |||||||||||||||||||||
|
CDX-CMBX.NA.BBB- |
3.00 | Monthly | 7.50 | USD | 233 | (52,159 | ) | (18,030 | ) | (34,129 | ) | |||||||||||||||||||||
|
CDX-CMBX.NA.BBB- |
3.00 | Monthly | 7.50 | USD | 279 | (62,461 | ) | (15,526 | ) | (46,935 | ) | |||||||||||||||||||||
| Goldman Sachs International |
|
|||||||||||||||||||||||||||||||
|
CDX-CMBX.NA.BBB- |
3.00 | Monthly | 7.50 | USD | 20 | (4,507 | ) | (2,857 | ) | (1,650 | ) | |||||||||||||||||||||
|
CDX-CMBX.NA.BBB- |
3.00 | Monthly | 7.50 | USD | 22 | (4,990 | ) | (2,671 | ) | (2,319 | ) | |||||||||||||||||||||
|
CDX-CMBX.NA.BBB- |
3.00 | Monthly | 7.50 | USD | 32 | (7,244 | ) | (3,544 | ) | (3,700 | ) | |||||||||||||||||||||
| 24 |
Sanford C. Bernstein Fund II, Inc. |
|
Table of Contents
| Swap Counterparty & Referenced Obligation | Fixed Rate (Pay) Receive |
Payment Frequency |
Implied Credit Spread at September 30, 2022 |
Notional |
Market Value |
Upfront Premiums Paid/ (Received) |
Unrealized Appreciation/ (Depreciation) |
|||||||||||||||||||||||||
|
CDX-CMBX.NA.BBB- |
3.00 |
% |
Monthly | 7.50 |
% |
USD | 32 | $ | (7,244 | ) | $ | (2,986 | ) | $ | (4,258 | ) | ||||||||||||||||
|
CDX-CMBX.NA.BBB- |
3.00 | Monthly | 7.50 | USD | 32 | (7,245 | ) | (2,760 | ) | (4,485 | ) | |||||||||||||||||||||
|
CDX-CMBX.NA.BBB- |
3.00 | Monthly | 7.50 | USD | 231 | (51,836 | ) | (35,362 | ) | (16,474 | ) | |||||||||||||||||||||
|
CDX-CMBX.NA.BBB- |
3.00 | Monthly | 7.50 | USD | 200 | (44,754 | ) | (23,538 | ) | (21,216 | ) | |||||||||||||||||||||
|
CDX-CMBX.NA.BBB- |
3.00 | Monthly | 7.50 | USD | 192 | (43,143 | ) | (15,560 | ) | (27,583 | ) | |||||||||||||||||||||
|
CDX-CMBX.NA.BBB- |
3.00 | Monthly | 7.50 | USD | 438 | (98,201 | ) | (46,883 | ) | (51,318 | ) | |||||||||||||||||||||
|
CDX-CMBX.NA.BBB- |
3.00 | Monthly | 7.50 | USD | 438 | (98,200 | ) | (46,864 | ) | (51,336 | ) | |||||||||||||||||||||
|
CDX-CMBX.NA.BBB- |
3.00 | Monthly | 7.50 | USD | 682 | (152,935 | ) | (48,799 | ) | (104,136 | ) | |||||||||||||||||||||
| JPMorgan Securities, LLC |
|
|||||||||||||||||||||||||||||||
|
CDX-CMBX.NA.BBB- |
3.00 | Monthly | 7.50 | USD | 40 | (9,015 | ) | (3,671 | ) | (5,344 | ) | |||||||||||||||||||||
|
CDX-CMBX.NA.BBB- |
3.00 | Monthly | 7.50 | USD | 42 | (9,499 | ) | (3,869 | ) | (5,630 | ) | |||||||||||||||||||||
|
CDX-CMBX.NA.BBB- |
3.00 | Monthly | 7.50 | USD | 99 | (22,216 | ) | (11,833 | ) | (10,383 | ) | |||||||||||||||||||||
|
CDX-CMBX.NA.BBB- |
3.00 | Monthly | 7.50 | USD | 243 | (54,413 | ) | (28,098 | ) | (26,315 | ) | |||||||||||||||||||||
| Morgan Stanley Capital Services LLC |
|
|||||||||||||||||||||||||||||||
|
CDX-CMBX.NA.BBB- |
3.00 | Monthly | 7.50 | USD | 265 | (59,403 | ) | (17,484 | ) | (41,919 | ) | |||||||||||||||||||||
|
|
|
|
|
|
|
|||||||||||||||||||||||||||
| $ | (1,184,039 | ) | $ | (499,542 | ) | $ | (684,497 | ) | ||||||||||||||||||||||||
|
|
|
|
|
|
|
|||||||||||||||||||||||||||
| ** | Principal amount less than 500. |
| (a) | Position, or a portion thereof, has been segregated to collateralize margin requirements for open centrally cleared swaps. |
| (b) | Position, or a portion thereof, has been segregated to collateralize OTC derivatives outstanding. |
| (c) | Security is exempt from registration under Rule 144A or Regulation S of the Securities Act of 1933. These securities are considered restricted, but liquid and may be resold in transactions exempt from registration. At September 30, 2022, the aggregate market value of these securities amounted to $185,968,262 or 26.2% of net assets. |
| (d) | Securities are perpetual and, thus, do not have a predetermined maturity date. The date shown, if applicable, reflects the next call date. |
| (e) | Floating Rate Security. Stated interest/floor/ceiling rate was in effect at September 30, 2022. |
| (f) | Security is exempt from registration under Rule 144A or Regulation S of the Securities Act of 1933. These securities, which represent 0.71% of net assets as of September 30, 2022, are considered illiquid and restricted. Additional information regarding such securities follows: |
| 144A/Restricted & Illiquid Securities | Acquisition Date |
Cost | Market Value |
Percentage of Net Assets |
||||||||||
|
GSF |
02/25/2021 | $ 1,153,847 | $ | 1,096,778 | 0.15 | % | ||||||||
|
GSF |
02/25/2021 | 1,847,082 | 1,697,612 | 0.24 | % | |||||||||
|
GSF |
02/25/2021 | 60,278 | 54,422 | 0.01 | % | |||||||||
|
2022 Annual Report |
25 | |
Table of Contents
Schedule of Investments (continued)
| 144A/Restricted & Illiquid Securities | Acquisition Date |
Cost | Market Value |
Percentage of Net Assets |
||||||||||
|
HFX Funding Issuer |
11/19/2020 |
$ 1,800,250 |
$ | 1,551,525 | 0.22 | % | ||||||||
|
JPMorgan Madison Avenue Securities Trust |
11/06/2015 | 47,007 | 45,203 | 0.01 | % | |||||||||
|
PMT Credit Risk Transfer Trust |
02/11/2020 | 245,340 | 232,759 | 0.03 | % | |||||||||
|
Terraform Global Operating LP |
02/08/2018 | 117,000 | 110,187 | 0.02 | % | |||||||||
|
Wells Fargo Credit Risk Transfer Securities Trust |
09/28/2015 | 187,930 | 172,259 | 0.02 | % | |||||||||
|
Wells Fargo Credit Risk Transfer Securities Trust |
09/28/2015 | 47,525 | 44,698 | 0.01 | % | |||||||||
| (g) | IOInterest Only. |
| (h) | Inverse interest only security. |
| (i) | Security in which significant unobservable inputs (Level 3) were used in determining fair value. |
| (j) | Pay-In-Kind Payments (PIK). The issuer may pay cash interest and/or interest in additional debt securities. Rates shown are the rates in effect at September 30, 2022. |
| (k) | Fair valued by the Adviser. |
| (l) | Non-income producing security. |
| (m) | Affiliated investments. |
| (n) | To obtain a copy of the funds shareholder report, please go to the Securities and Exchange Commissions website at www.sec.gov, or call AB at (800) 227-4618. |
| (o) | The rate shown represents the 7-day yield as of period end. |
Currency
Abbreviations:
EUREuro
JPYJapanese
Yen
USDUnited States Dollar
Glossary:
ABSAsset-Backed Securities
ARMsAdjustable
Rate Mortgages
CBTChicago Board of Trade
CDX-CMBX.NANorth American Commercial Mortgage-Backed Index
CDX-NAHYNorth American High Yield Credit Default Swap Index
CLOCollateralized Loan Obligations
CMBSCommercial Mortgage-Backed Securities
LIBORLondon Interbank Offered Rate
OSEOsaka Securities Exchange
REITReal
Estate Investment Trust
REMICsReal Estate Mortgage Investment Conduits
SOFRSecured Overnight Financing Rate
TBATo
Be Announced
See notes to financial statements.
| 26 |
Sanford C. Bernstein Fund II, Inc. |
|
Table of Contents
Statement of Assets and LiabilitiesSeptember 30, 2022
| INTERMEDIATE DURATION INSTITUTIONAL PORTFOLIO |
||||
| ASSETS | ||||
|
Investments in securities, at value |
||||
|
Unaffiliated issuers (cost $850,431,018) |
$ | 750,804,052 | ||
|
Affiliated issuers (cost $7,113,855) |
7,113,855 | |||
|
Cash collateral due from broker |
3,282,541 | |||
|
Receivables: |
||||
|
Unaffiliated interest and dividends |
4,413,845 | |||
|
Affiliated dividends |
14,777 | |||
|
Foreign withholding tax reclaims |
4,090 | |||
|
Variation margin on centrally cleared swaps |
79,723 | |||
|
Unrealized appreciation of forward currency exchange contracts |
50 | |||
|
|
|
|||
|
Total assets |
765,712,933 | |||
|
|
|
|||
| LIABILITIES | ||||
|
Due to custodian |
97,069 | |||
|
Payables: |
||||
|
Dividends to shareholders |
348,331 | |||
|
Investment securities purchased |
51,484,230 | |||
|
Capital shares redeemed |
2,644,212 | |||
|
Variation margin on futures |
857,774 | |||
|
Advisory fee |
240,668 | |||
|
Administrative fee |
29,654 | |||
|
Foreign capital gains taxes |
25,391 | |||
|
Transfer Agent fee |
2,974 | |||
|
Accrued expenses and other liabilities |
221,465 | |||
|
Market value on credit default swaps (net premiums received $499,542) |
1,184,039 | |||
|
Unrealized depreciation of forward currency exchange contracts |
86,838 | |||
|
|
|
|||
|
Total liabilities |
57,222,645 | |||
|
|
|
|||
|
NET ASSETS |
$ | 708,490,288 | ||
|
|
|
|||
|
SHARES OF CAPITAL STOCK OUTSTANDING |
55,708,418 | |||
|
|
|
|||
|
NET ASSET VALUE, OFFERING AND REDEMPTION PRICE PER SHARE |
$ | 12.72 | ||
|
|
|
|||
| NET ASSETS CONSIST OF: | ||||
|
Capital stock, at par* |
$ | 55,708 | ||
|
Additional paid-in capital |
845,895,251 | |||
|
Accumulated loss |
(137,460,671 | ) | ||
|
|
|
|||
| $ | 708,490,288 | |||
|
|
|
|||
* The Sanford C. Bernstein Fund II, Inc., has authorized 18 billion shares of common stock with par value of $.001 per
share.
See Notes to Financial Statements.
|
2022 Annual Report |
27 | |
Table of Contents
Statement of Operationsfor the year ended September 30, 2022
| INTERMEDIATE DURATION INSTITUTIONAL PORTFOLIO |
||||
| INVESTMENT INCOME | ||||
|
Income: |
||||
|
Interest |
$ | 19,523,023 | ||
|
DividendsAffiliated issuers |
57,238 | |||
|
|
|
|||
|
Total income |
19,580,261 | |||
|
|
|
|||
|
Expenses: |
||||
|
Advisory fee (see Note 2A) |
3,839,602 | |||
|
Custody and accounting fees |
121,994 | |||
|
Transfer Agent fee |
18,423 | |||
|
Auditing and tax fees |
117,378 | |||
|
Administrative |
108,481 | |||
|
Registration fees |
36,072 | |||
|
Legal fees |
30,641 | |||
|
Directors fees and expenses |
28,058 | |||
|
Printing fees |
22,033 | |||
|
Miscellaneous |
52,587 | |||
|
|
|
|||
|
Total expenses |
4,375,269 | |||
|
Less: expenses waived and reimbursed by the Adviser (see Note 2A and 2C) |
(541,397 | ) | ||
|
|
|
|||
|
Net expenses |
3,833,872 | |||
|
|
|
|||
|
Net investment income |
15,746,389 | |||
|
|
|
|||
| REALIZED AND UNREALIZED GAIN (LOSS) ON INVESTMENT AND FOREIGN CURRENCY TRANSACTIONS | ||||
|
Net realized gain (loss) on: |
||||
|
Investment transactions (a) |
(21,255,892 | ) | ||
|
Forward currency exchange contracts |
788,239 | |||
|
Futures |
(14,309,913 | ) | ||
|
Swaps |
(1,030,826 | ) | ||
|
Foreign currency transactions |
1,212,653 | |||
|
|
|
|||
|
Net realized loss on investment and foreign currency transactions |
(34,595,739 | ) | ||
|
|
|
|||
|
Net change in unrealized appreciation/depreciation of: |
||||
|
Investments (b) |
(118,381,802 | ) | ||
|
Forward currency exchange contracts |
(76,595 | ) | ||
|
Futures |
(2,368,025 | ) | ||
|
Swaps |
4,526,361 | |||
|
Foreign currency denominated assets and liabilities and other assets |
(19,083 | ) | ||
|
|
|
|||
|
Net change in unrealized appreciation/depreciation of investments and foreign currency |
(116,319,144 | ) | ||
|
|
|
|||
|
Net realized and unrealized loss on investment and foreign currency transactions |
(150,914,883 | ) | ||
|
|
|
|||
|
Net decrease in net assets resulting from operations |
$ | (135,168,494 | ) | |
|
|
|
|||
(a) Net of foreign realized capital gains taxes of $12,992.
(b) Net of increase in accrued foreign capital gains taxes on unrealized gains of $2,236..
See Notes to Financial Statements.
| 28 |
Sanford C. Bernstein Fund II, Inc. |
|
Table of Contents
Statement of Changes in Net Assets
| INTERMEDIATE DURATION INSTITUTIONAL PORTFOLIO |
||||||||
|
YEAR ENDED 9/30/22 |
YEAR ENDED 9/30/21 |
|||||||
| INCREASE (DECREASE) IN NET ASSETS FROM | ||||||||
|
Operations: |
||||||||
|
Net investment income |
$ | 15,746,389 | $ | 18,481,261 | ||||
|
Net realized gain (loss) on investment and foreign currency transactions |
(34,595,739 | ) | 13,587,357 | |||||
|
Net change in unrealized appreciation/depreciation of investments and foreign currency denominated |
(116,319,144 | ) | (31,654,804 | ) | ||||
|
|
|
|
|
|||||
|
Net increase (decrease) in net assets resulting from operations |
(135,168,494 | ) | 413,814 | |||||
|
|
|
|
|
|||||
|
Distributions to shareholders |
(29,599,918 | ) | (32,340,013 | ) | ||||
|
|
|
|
|
|||||
|
Capital-share transactions: |
||||||||
|
Net proceeds from sales of shares |
80,941,080 | 263,341,628 | ||||||
|
Net proceeds from sales of shares issued to shareholders on reinvestment of dividends and |
26,986,366 | 29,479,217 | ||||||
|
|
|
|
|
|||||
|
Total proceeds from shares sold |
107,927,446 | 292,820,845 | ||||||
|
Cost of shares redeemed |
(251,653,718 | ) | (149,417,820 | ) | ||||
|
|
|
|
|
|||||
|
Net increase (decrease) in net assets from capital-share transactions |
(143,726,272 | ) | 143,403,025 | |||||
|
|
|
|
|
|||||
|
Net increase (decrease) in net assets |
(308,494,684 | ) | 111,476,826 | |||||
| NET ASSETS: | ||||||||
|
Beginning of period |
1,016,984,972 | 905,508,146 | ||||||
|
|
|
|
|
|||||
|
End of period |
$ | 708,490,288 | $ | 1,016,984,972 | ||||
|
|
|
|
|
|||||
See Notes to Financial Statements.
|
2022 Annual Report |
29 | |
Table of Contents
Selected per-share data and ratios for a share of capital stock outstanding for the Portfolio for each of the periods
presented:
|
INTERMEDIATE DURATION INSTITUTIONAL PORTFOLIO |
||||||||||||||||||||
| YEAR ENDED 9/30/22 |
YEAR ENDED 9/30/21 |
YEAR ENDED 9/30/20 |
YEAR ENDED 9/30/19 |
YEAR ENDED 9/30/18 |
||||||||||||||||
|
Net asset value, beginning of period |
$ | 15.50 | $ | 16.04 | $ | 15.46 | $ | 14.55 | $ | 15.08 | ||||||||||
|
|
|
|
|
|
|
|
|
|
|
|||||||||||
|
Income from investment operations |
||||||||||||||||||||
|
Investment income, net (a)(b) |
0.26 | 0.30 | 0.40 | 0.44 | 0.36 | |||||||||||||||
|
Net realized and unrealized gain (loss) on investment and foreign currency transactions |
(2.55 | ) | (0.29 | ) | 0.65 | 0.95 | (0.51 | ) | ||||||||||||
|
Contributions from affiliates |
0 | 0 | 0 | 0.00 | (c) | 0.00 | (c) | |||||||||||||
|
|
|
|
|
|
|
|
|
|
|
|||||||||||
|
Total from investment operations |
(2.29 | ) | 0.01 | 1.05 | 1.39 | (0.15 | ) | |||||||||||||
|
|
|
|
|
|
|
|
|
|
|
|||||||||||
|
Less: Dividends and Distributions |
||||||||||||||||||||
|
Dividends from net investment income |
(0.27 | ) | (0.33 | ) | (0.44 | ) | (0.48 | ) | (0.38 | ) | ||||||||||
|
Dividends from net realized gain on investment transactions |
(0.22 | ) | (0.22 | ) | (0.03 | ) | 0 | 0 | ||||||||||||
|
|
|
|
|
|
|
|
|
|
|
|||||||||||
|
Total dividends and distributions |
(0.49 | ) | (0.55 | ) | (0.47 | ) | (0.48 | ) | (0.38 | ) | ||||||||||
|
|
|
|
|
|
|
|
|
|
|
|||||||||||
|
Net asset value, end of period |
$ | 12.72 | $ | 15.50 | $ | 16.04 | $ | 15.46 | $ | 14.55 | ||||||||||
|
|
|
|
|
|
|
|
|
|
|
|||||||||||
|
Total return (d) |
(15.13)% | 0.02% | 6.96% | 9.70% | (0.98)% | |||||||||||||||
| RATIOS/SUPPLEMENTAL DATA | ||||||||||||||||||||
|
Net assets, end of period (000 omitted) |
$708,490 | $1,016,985 | $905,508 | $886,574 | $734,175 | |||||||||||||||
|
Average net assets (000 omitted) |
$853,245 | $963,532 | $879,658 | $816,533 | $702,953 | |||||||||||||||
|
Ratio to average net assets of: |
||||||||||||||||||||
|
Expenses, net of waivers/reimbursements |
0.45% | 0.45% | 0.45% | 0.45% | 0.45% | |||||||||||||||
|
Expenses, before waivers/reimbursements |
0.51% | 0.52% | 0.52% | 0.52% | 0.55% | |||||||||||||||
|
Net investment income (b) |
1.85% | 1.92% | 2.55% | 2.98% | 2.47% | |||||||||||||||
|
Portfolio turnover rate (e) |
129% | 118% | 86% | 70% | 189% | |||||||||||||||
| (a) | Based on average shares outstanding. |
| (b) | Net of expenses waived by the Adviser. |
| (c) | Amount is less than $.005. |
| (d) | Total investment return is calculated assuming an initial investment made at the net asset value at the beginning of the period, reinvestment of all dividends and distributions at net asset value during the period, and redemption on the last day of the period. Total return does not reflect the deduction of taxes that a shareholder would pay on fund distributions or the redemption of fund shares. Total investment return calculated for a period of less than one year is not annualized. |
| (e) | The Portfolio accounts for dollar roll transactions as purchases and sales. |
See Notes to Financial Statements.
| 30 |
Sanford C. Bernstein Fund II, Inc. |
|
Table of Contents
| NOTE 1. |
Organization and Significant Accounting Policies |
Sanford C. Bernstein Fund II, Inc. (the Fund) is registered under the Investment Company Act of 1940 as an open-end registered investment company. The Fund, which is a Maryland corporation, currently comprises one portfolio, the Intermediate Duration Institutional Portfolio (the Portfolio). The financial
statements have been prepared in conformity with U.S. generally accepted accounting principles (U.S. GAAP), which require management to make certain estimates and assumptions that affect the reported amounts of assets and liabilities in
the financial statements and amounts of income and expenses during the reporting period. Actual results could differ from those estimates. The Portfolio is an investment company under U.S. GAAP and follows the accounting and reporting guidance
applicable to investment companies. The following is a summary of significant accounting policies followed by the Portfolio.
| A. | Portfolio Valuation |
Portfolio securities are valued at market value determined
on the basis of market quotations or, if market quotations are not readily available or are unreliable, at fair value as determined in accordance with procedures approved by and under the oversight of the Portfolios Board of
Directors (the Board). Pursuant to these procedures, AllianceBernstein L.P. (the Adviser) serves as the Portfolios valuation designee pursuant to Rule 2a-5 of the 1940
Act. In this capacity, the Adviser is responsible, among other things, for making all fair value determinations relating to the Portfolios portfolio investments, subject to the Boards oversight.
In general, the market values of securities which are readily available and deemed reliable are determined as follows: securities listed on a
national securities exchange (other than securities listed on the NASDAQ Stock Market, Inc. (NASDAQ)) or on a foreign securities exchange are valued at the last sale price at the close of the exchange or foreign securities exchange. If
there has been no sale on such day, the securities are valued at the last traded price from the previous day. Securities listed on more than one exchange are valued by reference to the principal exchange on which the securities are traded;
securities listed only on NASDAQ are valued in accordance with the NASDAQ Official Closing Price; listed or over the counter (OTC) market put or call options are valued at the mid level between the current bid and ask prices. If either a
current bid or current ask price is unavailable, the Adviser will have discretion to determine the best valuation (e.g., last trade price in the case of listed options); open futures are valued using the closing settlement price or, in the absence
of such a price, the most recent quoted bid price. If there are no quotations available for the day of valuation, the last available closing settlement price is used; U.S. Government securities and any other debt instruments having 60 days or less
remaining until maturity are generally valued at market by an independent pricing vendor, if a market price is available. If a market price is not available, the securities are valued at amortized cost. This methodology is commonly used for short
term securities that have an original maturity of 60 days or less, as well as short term securities that had an original term to maturity that exceeded 60 days. In instances when amortized cost is utilized, the Valuation Committee (the
Committee) must reasonably conclude that the utilization of amortized cost is approximately the same as the fair value of the security. Factors the Committee will consider include, but are not limited to, an impairment of the
creditworthiness of the issuer or material changes in interest rates. Fixed-income securities, including mortgage-backed and asset-backed securities, may be valued on the basis of prices provided by a pricing service or at a price obtained from one
or more of the major broker-dealers. In cases where broker-dealer quotes are obtained, the Adviser may establish procedures whereby changes in market yields or spreads are used to adjust, on a daily basis, a recently obtained quoted price on a
security. Swaps and other derivatives are valued daily, primarily using independent pricing services, independent pricing models using market inputs, as well as third party broker-dealers or counterparties.
Open-end mutual funds are valued at the closing net asset value per share, while exchange traded funds are valued at the closing market price per share.
Securities for which market quotations are not readily available (including restricted securities) or are deemed unreliable are valued at fair
value as deemed appropriate by the Adviser. Factors considered in making this determination may include, but are not limited to, information obtained by contacting the issuer, analysts, analysis of the issuers financial statements or other
available documents. In addition, the Portfolio may use fair value pricing for securities primarily traded in non-U.S. markets because most foreign markets close well before the Portfolio values its securities
at 4:00 p.m., Eastern Time. The earlier close of these foreign markets gives rise to the possibility that significant events, including broad market moves, may have occurred in the interim and may materially affect the value of those securities. To
account for this, the Portfolio generally values many of its foreign equity securities using fair value prices based on third party vendor modeling tools to the extent available.
|
2022 Annual Report |
31 | |
Table of Contents
Notes to Financial Statements (continued)
| B. | Fair Value Measurements |
In accordance with U.S. GAAP regarding fair value
measurements, fair value is defined as the price that the Portfolio would receive to sell an asset or pay to transfer a liability in an orderly transaction between market participants at the measurement date. U.S. GAAP establishes a framework for
measuring fair value, and a three-level hierarchy for fair value measurements based upon the transparency of inputs to the valuation of an asset or liability (including those based on their market values as described in Note 1.A above). Inputs may
be observable or unobservable and refer broadly to the assumptions that market participants would use in pricing the asset or liability. Observable inputs reflect the assumptions market participants would use in pricing the asset or liability based
on market data obtained from sources independent of the Portfolio. Unobservable inputs reflect the Portfolios own assumptions about the assumptions that market participants would use in pricing the asset or liability based on the best
information available in the circumstances. Each investment is assigned a level based upon the observability of the inputs which are significant to the overall valuation. The three-tier hierarchy of inputs is summarized below.
| |
Level 1quoted prices in active markets for identical investments |
| |
Level 2other significant observable inputs (including quoted prices for similar investments, interest |
| |
Level 3significant unobservable inputs (including the Portfolios own assumptions in determining the |
The fair value of debt instruments, such as bonds, and over-the-counter derivatives is generally based on market price quotations, recently executed market transactions (where observable) or industry recognized modeling techniques and are generally classified as
Level 2. Pricing vendor inputs to Level 2 valuations may include quoted prices for similar investments in active markets, interest rate curves, coupon rates, currency rates, yield curves, option adjusted spreads, default rates, credit
spreads and other unique security features in order to estimate the relevant cash flows which are then discounted to calculate fair values. If these inputs are unobservable and significant to the fair value, these investments will be classified as
Level 3.
Where readily available market prices or relevant bid prices are not available for certain equity investments, such
investments may be valued based on similar publicly traded investments, movements in relevant indices since last available prices or based upon underlying company fundamentals and comparable company data (such as multiples to earnings or other
multiples to equity). Where an investment is valued using an observable input, such as another publicly traded security, the investment will be classified as Level 2. If management determines that an adjustment is appropriate based on
restrictions on resale, illiquidity or uncertainty, and such adjustment is a significant component of the valuation, the investment will be classified as Level 3. An investment will also be classified as Level 3 where management uses
company fundamentals and other significant inputs to determine the valuation.
Valuations of mortgage-backed or other asset-backed
securities, by pricing vendors, are based on both proprietary and industry recognized models and discounted cash flow techniques. Significant inputs to the valuation of these instruments are: the value of collateral, the rates and timing of
delinquencies, the rates and timing of prepayments, and default and loss expectations, which are driven in part by housing prices for residential mortgages. Significant inputs are determined based on relative value analyses, which incorporate
comparisons to instruments with similar collateral and risk profiles, including relevant indices. Mortgage and asset-backed securities for which management has collected current observable data through pricing services are generally categorized
within Level 2. Those investments for which current observable data has not been provided are classified as Level 3.
Other
fixed income investments, including non-U.S. government and corporate debt, are generally valued using quoted market prices, if available, which are typically impacted by current interest rates, maturity dates
and any perceived credit risk of the issuer. Additionally, in the absence of quoted market prices, these inputs are used by pricing vendors to derive a valuation based upon industry or proprietary models which incorporate issuer specific data with
relevant yield/spread comparisons with more widely quoted bonds with similar key characteristics. Those investments for which there are observable inputs are classified as Level 2. Where the inputs are not observable, the investments are
classified as Level 3.
| 32 |
Sanford C. Bernstein Fund II, Inc. |
|
Table of Contents
The following table
summarizes the valuation of the Portfolios investments by the above fair value hierarchy levels as of September 30, 2022:
| INVESTMENTS IN SECURITIES: | LEVEL 1 | LEVEL 2 | LEVEL 3 | TOTAL | ||||||||||||
|
Assets: |
|
|||||||||||||||
|
GovernmentsTreasuries |
$ | 0 | $ | 286,721,389 | $ | 0 | $ | 286,721,389 | ||||||||
|
CorporatesInvestment Grade |
0 | 164,081,859 | 0 | 164,081,859 | ||||||||||||
|
Mortgage Pass-Throughs |
0 | 122,233,387 | 0 | 122,233,387 | ||||||||||||
|
Collateralized Mortgage Obligations |
0 | 54,296,518 | 0 | 54,296,518 | ||||||||||||
|
Asset-Backed Securities |
0 | 37,038,545 | 0 | 37,038,545 | ||||||||||||
|
Commercial Mortgage-Backed Securities |
0 | 22,050,887 | 2,848,812 | 24,899,699 | ||||||||||||
|
Collateralized Loan Obligations |
0 | 20,436,186 | 0 | 20,436,186 | ||||||||||||
|
CorporatesNon-Investment Grade |
0 | 14,691,250 | 0 | 14,691,250 | ||||||||||||
|
Local GovernmentsUS Municipal Bonds |
0 | 6,795,357 | 0 | 6,795,357 | ||||||||||||
|
Emerging MarketsCorporate Bonds |
0 | 3,346,043 | 0 | 3,346,043 | ||||||||||||
|
Common Stocks |
0 | 0 | 2,239,293 | 2,239,293 | ||||||||||||
|
Agencies |
0 | 2,132,924 | 0 | 2,132,924 | ||||||||||||
|
Emerging MarketsSovereigns |
0 | 2,048,268 | 0 | 2,048,268 | ||||||||||||
|
Quasi-Sovereigns |
0 | 2,036,925 | 0 | 2,036,925 | ||||||||||||
|
GovernmentsSovereign Bonds |
0 | 482,980 | 0 | 482,980 | ||||||||||||
|
Short-Term Investments: |
||||||||||||||||
|
U.S. Treasury Bills |
0 | 7,323,429 | 0 | 7,323,429 | ||||||||||||
|
Investment Companies |
7,113,855 | 0 | 0 | 7,113,855 | ||||||||||||
|
Total Investments in Securities |
7,113,855 | 745,715,947 | 5,088,105 | 757,917,907 | ||||||||||||
|
Other Financial Instruments (a): |
||||||||||||||||
|
Assets: |
|
|||||||||||||||
|
Futures |
74,357 | 0 | 0 | 74,357 | (b) | |||||||||||
|
Forward Currency Exchange Contracts |
0 | 50 | 0 | 50 | ||||||||||||
|
Centrally Cleared Credit Default Swaps |
0 | 572,115 | 0 | 572,115 | (b) | |||||||||||
|
Centrally Cleared Interest Rate Swaps |
0 | 639,975 | 0 | 639,975 | (b) | |||||||||||
|
Liabilities: |
|
|||||||||||||||
|
Futures |
(3,177,397 | ) | 0 | 0 | (3,177,397 | )(b) | ||||||||||
|
Forward Currency Exchange Contracts |
0 | (86,838 | ) | 0 | (86,838 | ) | ||||||||||
|
Credit Default Swaps |
0 | (1,184,039 | ) | 0 | (1,184,039 | ) | ||||||||||
|
Total |
$ | 4,010,815 | $ | 745,657,210 | $ | 5,088,105 | $ | 754,756,130 | ||||||||
| (a) |
Other financial instruments are derivative instruments, such as futures, forwards and swaps, which are valued |
| (b) |
Only variation margin receivable/(payable) at period end is reported within the statement of assets and |
| C. | Foreign Currency Translation |
The accounting records of the Portfolio are
maintained in U.S. dollars. Prices of securities and other assets and liabilities denominated in non-U.S. currencies are translated into U.S. dollars using the exchange rate at 4:00 p.m., Eastern Time. Amounts
related to the purchases and sales of securities, investment income and expenses are translated at the rates of exchange prevailing on the respective dates of such transactions.
|
2022 Annual Report |
33 | |
Table of Contents
Notes to Financial Statements (continued)
Net
realized gain or loss on foreign currency transactions represents net foreign exchange gains or losses from the disposition of foreign currencies, currency gains or losses realized between the trade and settlement dates on security transactions and
the difference between the amount of dividends, interest and foreign withholding taxes recorded on the Portfolios books and the U.S. dollar equivalent amount actually received or paid. Net unrealized currency gains and losses arising from
valuing foreign currency denominated assets and liabilities, other than security investments, at the current exchange rate are reflected as part of unrealized appreciation/depreciation on foreign currencies.
The Portfolio does not isolate that portion of the results of operations arising as a result of changes in the foreign exchange rates from the
changes in the market prices of securities held at period end. The Portfolio does isolate the effect of changes in foreign exchange rates from changes in market prices of debt securities sold during the year, as required by the Internal Revenue
Code.
The Portfolio may invest in foreign securities and foreign currency transactions that may involve risks not associated with
domestic investments as a result of the level of governmental supervision and regulation of foreign securities markets and the possibility of political or economic instability, among others.
The Portfolio intends to continue to comply with the requirements of
Subchapter M of the Internal Revenue Code of 1986 as they apply to regulated investment companies. By so complying, the Portfolio will not be subject to federal and state income taxes to the extent that all of its income is distributed. The
Portfolio may be subject to taxes imposed by countries in which it invests. Such taxes are generally based on income and/or capital gains earned or repatriated. Taxes are accrued and applied to net investment income, net realized gains and net
unrealized appreciation/depreciation as such income and/or gains are earned based on managements understanding of applicable local tax law.
In accordance with U.S. GAAP requirements regarding accounting for uncertainties in income taxes, management has analyzed the Portfolios
tax positions taken or expected to be taken on federal and state income tax returns for all open tax years (the current and the prior three tax years) and has concluded that no provision for income tax is required in the Portfolios financial
statements.
| E. | Security Transactions and Related Investment Income |
Security transactions are
accounted for on the trade date (the date the buy or sell order is executed). Securities gains and losses are calculated on the identified cost basis. Interest income is recorded on the accrual basis and dividend income is recorded on the ex-dividend date or as soon as the Portfolio is informed of the dividend. Non-cash dividends, if any, are recorded on the ex-dividend
date at the fair value of the securities received. The Portfolio amortizes premiums and accretes discounts as adjustments to interest income. The Portfolio accounts for distributions received from REIT investments or from regulated investment
companies as dividend income, realized gain, or return of capital based on information provided by the REIT or the investment company.
| F. | Securities Transactions on a When-Issued or Delayed-Delivery Basis |
The
Portfolio may purchase securities on a when-issued basis or purchase or sell securities on a delayed-delivery basis. At the time the Portfolio commits to purchase a security on a when-issued or delayed-delivery basis, the Portfolio will record the
transaction and use the securitys value in determining the Portfolios net asset value. At the time the Portfolio commits to sell a security on a delayed-delivery basis, the Portfolio will record the transaction and exclude the
securitys value in determining the Portfolios net asset value.
| G. | Distribution of Income and Gains |
Net investment income of the Portfolio is
declared and recorded as a dividend to shareholders daily and is payable to shareholders monthly.
Distributions of net realized gains,
less any available loss carryforwards, if any, for the Portfolio will be paid to shareholders at least once a year, and recorded on the ex-dividend date.
Elements of realized gains and net investment income may be recorded in different accounting periods for financial reporting (book) and
federal income tax (tax) purposes (temporary differences). To the extent that such distributions
| 34 |
Sanford C. Bernstein Fund II, Inc. |
|
Table of Contents
required for tax purposes
exceed income and gains recorded for book purposes as a result of such temporary differences, excess distributions are reflected in the accompanying statement of assets and liabilities. To the extent distributions exceed income and gains
for tax purposes, such distributions would be shown as return of capital on the statement of changes in net assets. Certain other differencespermanent differencesarise because treatment of elements of income and gains is
different between book and tax accounting. Permanent differences are reclassified in the year they arise.
During the current fiscal year,
there were no permanent differences that resulted in adjustments to distributable earnings or additional paid-in capital.
| NOTE 2. |
Investment Management and Transactions with Affiliated Persons |
Under the advisory agreement between the Fund and Adviser, the
Portfolio pays the Adviser an advisory fee at an annual rate of 0.45% of the first $2.5 billion, 0.40% of the next $2.5 billion, 0.35% of the next $5 billion and 0.30% in excess of $8 billion of the average daily net assets of
the Portfolio. Pursuant to an Expense Limitation Agreement, during the reporting period, the Adviser waived a portion of its advisory fee or reimbursed the Portfolio for a portion of its expenses to the extent necessary to limit the Portfolios
expenses to 0.45%. This waiver extends through January 28, 2023 and may be extended by the Adviser for additional one-year terms. For the year ended September 30, 2022, the aggregate amount of such
fee waiver was $532,011.
| B. | Distribution Arrangements |
Under the Distribution Agreement between the Fund, on
behalf of the Portfolio, and Sanford C. Bernstein & Co., LLC (the Distributor), the Distributor agrees to act as agent to sell shares of the Portfolio. The Distributor receives no fee for this service, and furthermore agrees to
pay all expenses arising from the performance of its obligations under this agreement. The Distributor is a wholly owned subsidiary of the Adviser.
| C. | Investments and other transactions with Affiliated Issuers |
The Portfolio may
invest in AB Government Money Market Portfolio (the Government Money Market Portfolio) which has a contractual annual advisory fee rate of .20% of the portfolios average daily net assets and bears its own expenses. The Adviser has
contractually agreed to waive .10% of the advisory fee of Government Money Market Portfolio (resulting in a net advisory fee of .10%) until August 31, 2023. In connection with the investment by the Portfolio in Government Money Market
Portfolio, the Adviser has contractually agreed to waive its advisory fee from the Portfolio in an amount equal to the Portfolios pro rata share of the effective advisory fee of Government Money Market Portfolio, as borne indirectly by the
Portfolio as an acquired fund fee and expense. For the year ended September 30, 2022, such waiver amounted to $9,386.
A summary of
the Portfolios transactions in AB mutual funds for the year ended September 30, 2022 is as follows:
| PORTFOLIO | MARKET VALUE 9/30/21 (000) |
PURCHASES AT COST (000) |
SALES PROCEEDS (000) |
MARKET VALUE 9/30/22 (000) |
DIVIDEND INCOME (000) |
|||||||||||||||
|
Government Money Market Portfolio |
$ | 3,938 | $ | 436,738 | $ | 433,562 | $ | 7,114 | $ | 57 | ||||||||||
| NOTE 3. |
Investment Security Transactions |
| A. | Purchases and Sales |
For the year ended September 30, 2022, the Portfolio
had purchases and sales transactions, excluding transactions in short-term instruments, as follows:
| PURCHASES | SALES | |||||||
|
Investment securities (excluding U.S. government securities) |
$ | 141,694,951 | $ | 229,573,956 | ||||
|
U.S. government securities |
968,535,101 | 953,633,809 | ||||||
|
2022 Annual Report |
35 | |
Table of Contents
Notes to Financial Statements (continued)
The
cost of investments for federal income tax purposes, gross unrealized appreciation and unrealized depreciation are as follows:
|
Cost |
$ | 858,034,816 | ||
|
|
|
|||
|
Gross unrealized appreciation |
$ | 6,041,807 | ||
|
Gross unrealized depreciation |
(104,863,911 | ) | ||
|
|
|
|||
|
Net unrealized appreciation |
$ | (98,822,104 | ) | |
|
|
|
|||
| B. | Derivative Financial Instruments |
The Portfolio may use derivatives in an effort
to earn income and enhance returns, to replace more traditional direct investments, to obtain exposure to otherwise inaccessible markets (collectively, investment purposes), or to hedge or adjust the risk profile of its portfolio.
The principal types of derivatives utilized by the Portfolio, as well as the methods in which they may be used are:
The Portfolio may buy or sell futures for investment purposes or for the purpose of hedging its portfolio against adverse effects of potential
movements in the market. The Portfolio bears the market risk that arises from changes in the value of these instruments and the imperfect correlation between movements in the price of the futures and movements in the price of the assets, reference
rates or indices which they are designed to track. Among other things, the Portfolio may purchase or sell futures for foreign currencies or options thereon for non-hedging purposes as a means of making direct
investment in foreign currencies, as described below under Currency Transactions.
At the time the Portfolio enters into
futures, the Portfolio deposits and maintains as collateral an initial margin with the broker, as required by the exchange on which the transaction is effected. Such amount is shown as cash collateral due from broker on the statement of assets and
liabilities. Pursuant to the contract, the Portfolio agrees to receive from or pay to the broker an amount of cash equal to the daily fluctuation in the value of the contract. Such receipts or payments are known as variation margin and are recorded
by the Portfolio as unrealized gains or losses. Risks may arise from the potential inability of a counterparty to meet the terms of the contract. The credit/counterparty risk for exchange-traded futures is generally less than privately negotiated
futures, since the clearinghouse, which is the issuer or counterparty to each exchange-traded future, has robust risk mitigation standards, including the requirement to provide initial and variation margin. When the contract is closed, the Portfolio
records a realized gain or loss equal to the difference between the value of the contract at the time it was opened and the time it was closed.
Use of long futures subjects the Portfolio to risk of loss in excess of the amounts shown on the statement of assets and liabilities, up to
the notional value of the futures. Use of short futures subjects the Portfolio to unlimited risk of loss. The Portfolio may enter into futures only on exchanges or boards of trade. The exchange or board of trade acts as the counterparty to each
futures transactions; therefore, the Portfolios credit risk is subject to failure of the exchange or board of trade. Under some circumstances, futures exchanges may establish daily limits on the amount that the price of futures can vary from
the previous days settlement price, which could effectively prevent liquidation of unfavorable positions.
During the year ended
September 30, 2022, the Portfolio held futures for hedging and non-hedging purposes.
| |
Forward Currency Exchange Contracts |
The Portfolio may enter into forward currency exchange contracts in order to hedge its exposure to changes in foreign currency exchange rates
on its foreign portfolio holdings, to hedge certain firm purchase and sale commitments denominated in foreign currencies and for non-hedging purposes as a means of making direct investments in foreign
currencies, as described below under Currency Transactions.
A forward currency exchange contract is a commitment to purchase
or sell a foreign currency at a future date at a negotiated forward rate. The gain or loss arising from the difference between the original contract and the closing of such contract would be included in net realized gain or loss on foreign currency
transactions. Fluctuations in the value of open forward currency exchange contracts are recorded for financial reporting purposes as unrealized appreciation and/or
| 36 |
Sanford C. Bernstein Fund II, Inc. |
|
Table of Contents
depreciation by the
Portfolio. Risks may arise from the potential inability of a counterparty to meet the terms of a contract and from unanticipated movements in the value of a foreign currency relative to the U.S. dollar.
During the year ended September 30, 2022, the Portfolio held forward currency exchange contracts for hedging and non-hedging purposes.
The Portfolio may enter into swaps to hedge its exposure to interest rates, credit risk, or currencies. The Portfolio may also enter into
swaps for non-hedging purposes as a means of gaining market exposures, including by making direct investments in foreign currencies, as described below under Currency Transactions. A swap is an
agreement that obligates two parties to exchange a series of cash flows at specified intervals based upon or calculated by reference to changes in specified prices or rates for a specified amount of an underlying asset. The payment flows are usually
netted against each other, with the difference being paid by one party to the other. In addition, collateral may be pledged or received by the Portfolio in accordance with the terms of the respective swaps to provide value and recourse to the
Portfolio or its counterparties in the event of default, bankruptcy or insolvency by one of the parties to the swap.
Risks may arise as a
result of the failure of the counterparty to the swap to comply with the terms of the swap. The loss incurred by the failure of a counterparty is generally limited to the net interim payment to be received by the Portfolio, and/or the termination
value at the end of the contract. Therefore, the Portfolio considers the creditworthiness of each counterparty to a swap in evaluating potential counterparty risk. This risk is mitigated by having a netting arrangement between the Portfolio and the
counterparty and by the posting of collateral by the counterparty to the Portfolio to cover the Portfolios exposure to the counterparty. Additionally, risks may arise from unanticipated movements in interest rates or in the value of the
underlying securities. The Portfolio accrues for the interim payments on swaps on a daily basis, with the net amount recorded within unrealized appreciation/depreciation of swaps on the statement of assets and liabilities, where applicable. Once the
interim payments are settled in cash, the net amount is recorded as realized gain/(loss) on swaps on the statement of operations, in addition to any realized gain/(loss) recorded upon the termination of swaps. Upfront premiums paid or received for
swaps are recognized as cost or proceeds on the statement of assets and liabilities and are amortized on a straight line basis over the life of the contract. Amortized upfront premiums are included in net realized gain/(loss) from swaps on the
statement of operations. Fluctuations in the value of swaps are recorded as a component of net change in unrealized appreciation/depreciation of swaps on the statement of operations.
Certain standardized swaps, including certain interest rate swaps and credit default swaps are subject to mandatory central clearing. Cleared
swaps are transacted through futures commission merchants (FCMs) that are members of central clearinghouses, with the clearinghouse serving as central counterparty, similar to transactions in futures contracts. Centralized clearing will
be required for additional categories of swaps on a phased-in basis based on requirements published by the Securities and Exchange Commission and Commodity Futures Trading Commission.
At the time the Portfolio enters into a centrally cleared swap, the Portfolio deposits and maintains as collateral an initial margin with the
broker, as required by the clearinghouse on which the transaction is effected. Such amount is shown as cash collateral due from broker on the statement of assets and liabilities. Pursuant to the contract, the Portfolio agrees to receive from or pay
to the broker an amount of cash equal to the daily fluctuation in the value of the contract. Such receipts or payments are known as variation margin and are recorded by the Portfolio as unrealized gains or losses. Risks may arise from the potential
inability of a counterparty to meet the terms of the contract. The credit/counterparty risk for centrally cleared swaps is generally less than non-centrally cleared swaps, since the clearinghouse, which is the
issuer or counterparty to each centrally cleared swap, has robust risk mitigation standards, including the requirement to provide initial and variation margin. When the contract is closed, the Portfolio records a realized gain or loss equal to the
difference between the value of the contract at the time it was opened and the time it was closed.
Interest Rate Swaps:
The Portfolio is subject to interest rate risk exposure in the normal course of pursuing its investment objectives. Because the Portfolio
holds fixed rate bonds, the value of these bonds may decrease if interest rates rise. To help hedge against this risk and to maintain its ability to generate income at prevailing market rates, the Portfolio may enter into interest rate swaps.
Interest rate swaps are agreements between two parties to exchange cash flows based on a notional amount. The Portfolio may elect to pay a fixed rate and receive a floating rate, or, receive a fixed rate and pay a floating rate on a notional amount.
|
2022 Annual Report |
37 | |
Table of Contents
Notes to Financial Statements (continued)
In
addition, the Portfolio may also enter into interest rate swap transactions to preserve a return or spread on a particular investment or portion of its portfolio, or protecting against an increase in the price of securities the Portfolio anticipates
purchasing at a later date. Interest rate swaps involve the exchange by a Portfolio with another party of their respective commitments to pay or receive interest (e.g., an exchange of floating rate payments for fixed rate payments) computed
based on a contractually-based principal (or notional) amount. Interest rate swaps are entered into on a net basis (i.e., the two payment streams are netted out, with the Portfolio receiving or paying, as the case may be, only the
net amount of the two payments).
During the year ended September 30, 2022, the Portfolio held interest rate swaps for hedging and non-hedging purposes.
Inflation (CPI) Swaps:
Inflation swap agreements are contracts in which one party agrees to pay the cumulative percentage increase in a price index (the Consumer
Price Index with respect to CPI swaps) over the term of the swap (with some lag on the inflation index), and the other pays a compounded fixed rate. Inflation swaps may be used to protect the net asset value, or NAV, of a Portfolio against an
unexpected change in the rate of inflation measured by an inflation index since the value of these agreements is expected to increase if there are unexpected inflation increases.
During the year ended September 30, 2022, the Portfolio held inflation (CPI) swaps for hedging and
non-hedging purposes.
Credit Default Swaps:
The Portfolio may enter into credit default swaps, including to manage its exposure to the market or certain sectors of the market, to reduce
its risk exposure to defaults by corporate and sovereign issuers held by the Portfolio, or to create exposure to corporate or sovereign issuers to which it is not otherwise exposed. The Portfolio may purchase credit protection (Buy
Contract) or provide credit protection (Sale Contract) on the referenced obligation of the credit default swap. During the term of the swap, the Portfolio receives/(pays) fixed payments from/(to) the respective counterparty,
calculated at the agreed upon rate applied to the notional amount. If the Portfolio is a buyer/(seller) of protection and a credit event occurs, as defined under the terms of the swap, the Portfolio will either (i) receive from the seller/(pay
to the buyer) of protection an amount equal to the notional amount of the swap (the Maximum Payout Amount) and deliver/(take delivery of) the referenced obligation or (ii) receive/(pay) a net settlement amount in the form of cash or
securities equal to the notional amount of the swap less the recovery value of the referenced obligation. In certain circumstances Maximum Payout Amounts may be partially offset by recovery values of the respective referenced obligations, upfront
premium received upon entering into the agreement, or net amounts received from settlement of buy protection credit default swaps entered into by the Portfolio for the same reference obligation with the same counterparty.
Credit default swaps may involve greater risks than if a Portfolio had invested in the referenced obligation directly. Credit default swaps
are subject to general market risk, liquidity risk, counterparty risk and credit risk. If the Portfolio is a buyer of protection and no credit event occurs, it will lose the payments it made to its counterparty. If the Portfolio is a seller of
protection and a credit event occurs, the value of the referenced obligation received by the Portfolio coupled with the periodic payments previously received, may be less than the Maximum Payout Amount it pays to the buyer, resulting in a net loss
to the Portfolio.
Implied credit spreads over U.S. Treasuries of comparable maturity utilized in determining the market value of credit
default swaps on issuers as of period end are disclosed in the schedule of investments. The implied spreads serve as an indicator of the current status of the payment/performance risk and typically reflect the likelihood of default by the issuer of
the referenced obligation. The implied credit spread of a particular reference obligation also reflects the cost of buying/selling protection and may reflect upfront payments required to be made to enter into the agreement. Widening credit spreads
typically represent a deterioration of the referenced obligations credit soundness and greater likelihood of default or other credit event occurring as defined under the terms of the agreement. A credit spread identified as
Defaulted indicates a credit event has occurred for the referenced obligation.
During the year ended September 30, 2022,
the Portfolio held credit default swaps for hedging and non-hedging purposes.
The Portfolio
typically enters into International Swaps and Derivatives Association, Inc. Master Agreements (ISDA Master Agreement) with its OTC derivative contract counterparties in order to, among other things, reduce its credit risk to OTC
counterparties. ISDA Master Agreements include provisions for general obligations, representations, collateral and events of default or termination. Under an ISDA Master Agreement, the Portfolio typically may offset with the OTC
| 38 |
Sanford C. Bernstein Fund II, Inc. |
|
Table of Contents
counterparty certain
derivative financial instruments payables and/or receivables with collateral held and/or posted and create one single net payment (close-out netting) in the event of default or termination. In the event
of a default by an OTC counterparty, the return of collateral with market value in excess of the Portfolios net liability, held by the defaulting party, may be delayed or denied.
The Portfolios ISDA Master Agreements may contain provisions for early termination of OTC derivative transactions in the event the net
assets of the Portfolio decline below specific levels (net asset contingent features). If these levels are triggered, the Portfolios OTC counterparty has the right to terminate such transaction and require the Portfolio to pay or
receive a settlement amount in connection with the terminated transaction. If OTC derivatives were held at period end, please refer to netting arrangements by the OTC counterparty table below for additional details.
During the year ended September 30, 2022, the Portfolio had entered into the following derivatives:
| ASSET DERIVATIVES | LIABILITY DERIVATIVES | |||||||||||
| DERIVATIVE TYPE | STATEMENT OF ASSETS AND LIABILITIES LOCATION |
FAIR VALUE | STATEMENT OF ASSETS AND LIABILITIES LOCATION |
FAIR VALUE | ||||||||
|
Interest rate contracts |
Receivable/Payable for variation margin on futures |
$ | 74,357 | * |
Receivable/Payable for variation margin on futures |
$ | 3,177,397 | * | ||||
|
Credit contracts |
Receivable/Payable for variation margin on centrally cleared swaps |
2,173 | * | |||||||||
|
Interest rate contracts |
Receivable/Payable for variation margin on centrally cleared swaps |
639,975 | * | |||||||||
|
Foreign currency contracts |
Unrealized appreciation on forward currency exchange contracts |
50 |
Unrealized depreciation on forward currency exchange contracts |
86,838 | ||||||||
|
Credit contracts |
Market value on credit default swaps |
1,184,039 | ||||||||||
|
Total |
$ | 716,555 | $ | 4,448,274 | ||||||||
| * |
Only variation margin receivable/payable at period end is reported within the statement of assets and |
| DERIVATIVE TYPE | LOCATION OF GAIN OR (LOSS) ON DERIVATIVES WITHIN STATEMENT OF OPERATIONS |
REALIZED GAIN OR (LOSS) ON DERIVATIVES |
CHANGE IN UNREALIZED APPRECIATION OR (DEPRECIATION) |
|||||||
|
Interest rate contracts |
Net realized gain (loss) on futures; Net change in unrealized appreciation/depreciation of |
$ | (14,309,913 | ) | $ | (2,368,025 | ) | |||
|
Foreign currency contracts |
Net realized gain (loss) on forward currency exchange contracts; Net change in unrealized |
788,239 | (76,595 | ) | ||||||
|
Interest rate contracts |
Net realized gain (loss) on swaps; Net change in unrealized appreciation/depreciation of |
(346,909 | ) | 1,110,557 | ||||||
|
Credit contracts |
Net realized gain (loss) on swaps; Net change in unrealized |
(683,917 | ) | 3,415,804 | ||||||
|
Total |
$ | (14,552,500 | ) | $ | 2,081,741 | |||||
|
2022 Annual Report |
39 | |
Table of Contents
Notes to Financial Statements (continued)
The
following table represents the average monthly volume of the Portfolios derivative transactions during the year ended September 30, 2022:
|
Futures: |
||||||||
|
Average notional amount of buy contracts |
$ | 132,267,061 | ||||||
|
Average notional amount of sale contracts |
$ | 37,348,064 | (a) | |||||
|
Forward Currency Exchange Contracts: |
||||||||
|
Average principal amount of buy contracts |
$ | 18,521,010 | (b) | |||||
|
Average principal amount of sale contracts |
$ | 48,246,765 | ||||||
|
Centrally Cleared Interest Rate Swaps: |
||||||||
|
Average notional amount |
$ | 19,454,917 | ||||||
|
Centrally Cleared Inflation Swaps: |
||||||||
|
Average notional amount |
$ | 26,681,667 | (a) | |||||
|
Credit Default Swaps: |
||||||||
|
Average notional amount of buy contracts |
$ | 20,718,000 | (a) | |||||
|
Average notional amount of sale contracts |
$ | 11,531,860 | ||||||
|
Centrally Cleared Credit Default Swaps: |
||||||||
|
Average notional amount of buy contracts |
$ | 15,965,636 | (c) | |||||
| (a) |
Positions were open for five months during the year. |
| (b) |
Positions were open for ten months during the year. |
| (c) |
Positions were open for nine months during the year. |
For financial reporting purposes, the Portfolio does not offset derivative assets and derivative liabilities that are subject to netting
arrangements in the statement of assets and liabilities.
All OTC derivatives held at period end were subject to netting arrangements. The
following table presents the Portfolios derivative assets and liabilities by OTC counterparty net of amounts available for offset under ISDA Master Agreements (MA) and net of the related collateral received/pledged by the Portfolio
as of September 30, 2022. Exchange-traded derivatives and centrally cleared swaps are not subject to netting arrangements and as such are excluded from the table.
| COUNTERPARTY | DERIVATIVE ASSETS SUBJECT TO A MA |
DERIVATIVES AVAILABLE FOR OFFSET |
CASH COLLATERAL RECEIVED* |
SECURITY COLLATERAL RECEIVED* |
NET AMOUNT OF DERIVATIVE ASSETS |
|||||||||||||||
|
State Street Bank & Trust Co. |
$ | 50 | $ | 0 | $ | 0 | $ | 0 | $ | 50 | ||||||||||
|
Total |
$ | 50 | $ | 0 | $ | 0 | $ | 0 | $ | 50 | ^ | |||||||||
| COUNTERPARTY | DERIVATIVE LIABILITIES SUBJECT TO A MA |
DERIVATIVES AVAILABLE FOR OFFSET |
CASH COLLATERAL PLEDGED* |
SECURITY COLLATERAL PLEDGED* |
NET AMOUNT OF DERIVATIVE LIABILITIES |
|||||||||||||||
|
Bank of America, NA |
$ | 86,838 | $ | 0 | $ | 0 | $ | 0 | $ | 86,838 | ||||||||||
|
Citigroup Global Markets, Inc. |
288,163 | 0 | 0 | (279,239 | ) | 8,924 | ||||||||||||||
|
Credit Suisse International |
221,031 | 0 | 0 | (216,238 | ) | 4,793 | ||||||||||||||
|
Goldman Sachs International |
520,299 | 0 | 0 | (520,299 | ) | 0 | ||||||||||||||
| 40 |
Sanford C. Bernstein Fund II, Inc. |
|
Table of Contents
| COUNTERPARTY | DERIVATIVE LIABILITIES SUBJECT TO A MA |
DERIVATIVES AVAILABLE FOR OFFSET |
CASH COLLATERAL PLEDGED* |
SECURITY COLLATERAL PLEDGED* |
NET AMOUNT OF DERIVATIVE LIABILITIES |
|||||||||||||||
|
JPMorgan Securities, LLC |
$ | 95,143 | $ | 0 | $ | 0 | $ | (94,721 | ) | $ | 422 | |||||||||
|
Morgan Stanley Capital Services LLC |
59,403 | 0 | 0 | (59,403 | ) | 0 | ||||||||||||||
|
Total |
$ | 1,270,877 | $ | 0 | $ | 0 | $ | (1,169,900 | ) | $ | 100,977 | ^ | ||||||||
| * |
The actual collateral received/pledged may be more than the amount reported due to over-collateralization. |
| ^ |
Net amount represents the net receivable/payable that would be due from/to the counterparty in the event of |
| C. | Currency Transactions |
The Portfolio may invest in non-U.S. Dollar-denominated securities on a currency hedged or unhedged basis. The Portfolio may seek investment opportunities by taking long or short positions in currencies through the use of currency-related
derivatives, including forward currency exchange contracts, futures and options on futures, swaps, and other options. The Portfolio may enter into transactions for investment opportunities when it anticipates that a foreign currency will appreciate
or depreciate in value but securities denominated in that currency are not held by the Portfolio and do not present attractive investment opportunities. Such transactions may also be used when the Adviser believes that it may be more efficient than
a direct investment in a foreign currency-denominated security. The Portfolio may also conduct currency exchange contracts on a spot basis (i.e., for cash at the spot rate prevailing in the currency exchange market for buying or selling currencies).
| D. | TBA and Dollar Rolls |
The Portfolio may invest in TBA mortgage-backed
securities. A TBA, or To Be Announced, trade represents a contract for the purchase or sale of mortgage-backed securities to be delivered at a future agreed-upon date; however, the specific mortgage pool numbers or the number of pools
that will be delivered to fulfill the trade obligation or terms of the contract are unknown at the time of the trade. Mortgage pools (including fixed-rate or variable-rate mortgages) guaranteed by the Government National Mortgage Association, or
GNMA, the Federal National Mortgage Association, or FNMA, or the Federal Home Loan Mortgage Corporation, or FHLMC, are subsequently allocated to the TBA transactions.
The Portfolio may enter into certain TBA transactions known as dollar rolls. Dollar rolls involve sales by the Portfolio of securities for
delivery in the current month and the Portfolio simultaneously contracting to repurchase substantially similar (same type and coupon) securities on a specified future date. During the roll period, the Portfolio forgoes principal and interest paid on
the securities. The Portfolio is compensated by the difference between the current sales price and the lower forward price for the future purchase (often referred to as the drop) as well as by the interest earned on the cash proceeds of
the initial sale. Dollar rolls involve the risk that the market value of the securities the Portfolio is obligated to repurchase under the agreement may decline below the repurchase price. Dollar rolls are speculative techniques. For the year ended
September 30, 2022, the Portfolio earned drop income of $837,394 which is included in interest income in the accompanying statement of operations.
| NOTE 4. |
Distributions to Shareholders |
The tax character of distributions paid during the fiscal years ended September 30, 2022 and September 30, 2021 were as follows:
| 2022 | 2021 | |||||||
|
Distributions paid from: |
||||||||
|
Ordinary income |
$ | 18,465,674 | $ | 23,987,974 | ||||
|
Net long-term capital gains |
11,134,244 | 8,352,039 | ||||||
|
|
|
|
|
|||||
|
Total taxable distributions paid |
$ | 29,599,918 | $ | 32,340,013 | ||||
|
|
|
|
|
|||||
|
2022 Annual Report |
41 | |
Table of Contents
Notes to Financial Statements (continued)
As of
September 30, 2022, the components of accumulated earnings/(deficit) on a tax basis were as follows:
|
Undistributed ordinary income |
$ | 851,550 | ||
|
Accumulated capital and other losses |
(39,099,204 | )(a) | ||
|
Unrealized appreciation/(depreciation) |
(98,839,295 | )(b) | ||
|
|
|
|||
|
Total accumulated earnings/(deficit) |
$ | (137,086,949 | )(c) | |
|
|
|
|||
| (a) |
As of September 30, 2022, the Fund had a net capital loss carryforward of $39,094,453. As of September 30, |
| (b) |
The differences between book-basis and tax-basis unrealized appreciation/(depreciation) are attributable |
| (c) |
The differences between book-basis and tax-basis components of accumulated earnings/(deficit) are attributable |
For tax purposes, net realized capital
losses may be carried over to offset future capital gains, if any. Funds are permitted to carry forward capital losses for an indefinite period, and such losses will retain their character as either short-term or long-term capital losses. As of
September 30, 2022, the Fund had a net short-term capital loss carryforward of $18,550,042 and a net long-term capital loss carryforward of $20,544,411, which may be carried forward for an indefinite period.
During the current fiscal year, there were no permanent differences that resulted in adjustments to accumulated loss or additional paid-in
capital.
| NOTE 5. |
Risks Involved in Investing in the Portfolio |
Interest-Rate RiskChanges in interest rates will affect the value of investments in fixed-income securities. When interest rates
rise, the value of existing investments in fixed-income securities tends to fall and this decrease in value may not be offset by higher income from new investments. Interest rate risk is generally greater for fixed-income securities with longer
maturities or durations. The Fund may be subject to a greater risk of rising interest rates than would normally be the case due to the end of a recent period of historically low rates and the effect of potential government fiscal and monetary policy
initiatives and resulting market reaction to those initiatives.
Credit RiskThis is the risk that the issuer or the guarantor
of a debt security, or the counterparty to a derivatives or other contract, will be unable or unwilling to make timely principal and/or interest payments, or to otherwise honor its obligations. The issuer or guarantor may default, potentially
causing a loss of the full principal amount of a security and accrued interest. The degree of risk for a particular security may be reflected in its credit rating. The credit rating of a fixed-income security may be downgraded after purchase, which
may adversely affect the value of the security. Investments in fixed-income securities with lower ratings tend to have a higher probability that an issuer will default or fail to meet its payment obligations, making credit risk greater for
medium-quality and lower-rated debt securities. Lower-rated debt securities and similar unrated securities (commonly known as junk bonds) have speculative elements or are predominantly speculative credit risks. At times when credit risk
is perceived to be greater, credit spreads (i.e., the difference between the yields on lower quality securities and the yields on higher quality securities) may get larger or widen. As a result, the values of the lower
quality securities may go down more and they may become harder to sell.
Duration RiskThe duration of a fixed-income security
may be shorter than or equal to full maturity of the fixed-income security. Fixed-income securities with longer durations have more interest rate risk and will decrease in price as interest rates rise. Securities that have final maturities longer
than their durations may be affected by increased credit spreads to a far greater degree than their durations would suggest, because they are exposed to credit risk until final maturity.
Inflation RiskThis is the risk that the value of assets or income from investments will be less in the future as inflation
decreases the value of money. As inflation increases, the value of the Portfolios assets can decline as can the value of the
| 42 |
Sanford C. Bernstein Fund II, Inc. |
|
Table of Contents
Portfolios
distributions. This risk is significantly greater for fixed-income securities with longer maturities. Rates of inflation have recently risen, which could adversely affect economies and markets.
Inflation-Protected Securities RiskThe terms of inflation-protected securities provide for the coupon and/or maturity value to be
adjusted based on changes in an inflation index. Decreases in the inflation rate or in investors expectations about inflation could cause these securities to underperform non-inflation-adjusted
securities on a total-return basis. In addition, there can be no assurance that the relevant inflation index will accurately measure the rate of inflation, in which case the securities may not work as intended. These securities may be more difficult
to trade or dispose of than other types of securities.
Foreign (Non-U.S.) Securities
RiskInvestments in foreign securities entail significant risks in addition to those customarily associated with investing in U.S. securities, such as less liquid, less transparent, less regulated and more volatile markets. These risks
include risks related to unfavorable or unsuccessful government actions, reduction of government or central bank support, inadequate accounting standards and auditing and financial recordkeeping requirements, lack of information, and adverse market,
economic, political and regulatory factors and social instability, all of which could disrupt the financial markets in which the Portfolio invests and adversely affect the value of the Portfolios assets.
Emerging-Markets Securities RiskThe risks of investing in foreign (non-U.S.) securities
are heightened with respect to issuers in emerging-market countries because the markets are less developed and less liquid and there may be a greater amount of economic, political and social uncertainty, and these risks are even more pronounced in
frontier markets, which are investable markets with lower total market capitalization and liquidity than the more developed emerging markets. Emerging markets typically have fewer medical and economic resources than more developed
countries, and thus they may be less able to control or mitigate the effects of a pandemic. In addition, the value of the Portfolios investments may decline because of factors such as unfavorable or unsuccessful government actions and
reduction of government or central bank support.
Derivatives RiskThe Portfolio may use derivatives as direct investments to
earn income, enhance return and broaden portfolio diversification, which entail greater risk than if used solely for hedging purposes. In addition to other risks such as the credit risk of the counterparty, derivatives involve the risk that changes
in the value of the derivative may not correlate with relevant assets, rates or indices. Derivatives may be difficult to price or unwind, and small changes may produce disproportionate losses for the Portfolio. Certain derivatives have the potential
for unlimited loss, regardless of the size of the initial investment. Assets required to be set aside or posted to cover or secure derivatives positions may themselves go down in value, and these collateral and other requirements may limit
investment flexibility. Some derivatives involve leverage, which can make the Portfolio more volatile and can compound other risks. Derivatives, especially
over-the-counter derivatives, are also subject to counterparty risk, which is the risk that the counterparty (the party on the other side of the transaction) on a
derivative transaction will be unable or unwilling to honor its contractual obligations to the Fund. Use of derivatives may have different tax consequences for the Portfolio than an investment in the underlying asset or index, and such differences
may affect the amount, timing and character of income distributed to shareholders. The U.S. government and certain foreign governments have adopted regulations governing derivatives markets, including mandatory clearing of certain derivatives as
well as additional regulations governing margin, reporting and registration requirements. The ultimate impact of the regulations remains unclear. Additional regulation may make derivatives more costly, limit their availability or utility, otherwise
adversely affect their performance, or disrupt markets.
Mortgage-Related Securities RiskMortgage-related securities
represent interests in pools of mortgages, including consumer loans or receivables held in trust. Mortgage-related securities are subject to credit, interest rate, prepayment and extension risks. These securities also are subject to risk
of default on the underlying mortgage, particularly during periods of economic downturn. Small movements in interest rates (both increases and decreases) may quickly and significantly reduce the value of certain mortgage-related securities.
Asset-related securities entail certain risks not presented by mortgage-backed securities, including the risk that it may be difficult to perfect the liens securing any collateral backing certain asset-backed securities.
Prepayment and Extension RiskPrepayment risk is the risk that a loan, bond or other security might be called or otherwise
converted, prepaid or redeemed before maturity. If this happens, particularly during a time of declining interest rates or credit spreads, the Portfolio will not benefit from the rise in market price that normally accompanies a decline in
|
2022 Annual Report |
43 | |
Table of Contents
Notes to Financial Statements (continued)
interest rates, and may not be able to invest the proceeds in securities providing as much income, resulting in a lower yield to the
Portfolio. Conversely, extension risk is the risk that as interest rates rise or spreads widen, payments of securities may occur more slowly than anticipated by the market. If this happens, the values of these securities may go down because their
interest rates are lower than current market rates and they remain outstanding longer than anticipated.
Subordination
RiskThe Portfolio may invest in securities that are subordinated to more senior securities of an issuer, or which represent interests in pools of such subordinated securities. Subordinated securities will be disproportionately affected by
a default or even a perceived decline in creditworthiness of the issuer. Subordinated securities are more likely to suffer a credit loss than non-subordinated securities of the same issuer, any loss incurred
by the subordinated securities is likely to be proportionately greater, and any recovery of interest or principal may take more time.
Management RiskThe Portfolio is subject to management risk because it is an actively managed investment portfolio. The Adviser
will apply its investment techniques and risk analyses in making investment decisions for the Portfolio, but these techniques, analyses and decisions may not work as intended or may not produce the desired results, and may, during certain periods,
result in increased volatility for the Portfolio or cause the value of the Portfolios shares to go down. In some cases, derivatives and other investment techniques may be unavailable, or the Adviser may determine not to use them, possibly even
under market conditions where their use could benefit the Portfolio. Some of these techniques may incorporate, or rely upon, quantitative models, but there is no guarantee that these models will generate accurate forecasts, reduce risk or otherwise
perform as expected. In addition, the Adviser may change the Portfolios investment strategies or policies from time to time. Those changes may not lead to the results intended by the Adviser and could have an adverse effect on the value or
performance of the Portfolio.
Illiquid Investments RiskIlliquid investments risk exists when particular investments are
difficult or impossible to purchase or sell, possibly preventing the Portfolio from purchasing or selling these securities at an advantageous price. Over recent years, regulatory changes have led to reduced liquidity in the marketplace, and the
capacity of dealers to make markets in fixed-income securities has been outpaced by the growth in the size of the fixed-income markets. Illiquid investments risk may be magnified in a rising interest rate environment, where the value and liquidity
of fixed-income securities generally go down.
Redemption RiskThe Portfolio may experience heavy redemptions that could cause
the Portfolio to liquidate its assets at inopportune times or unfavorable prices or increase or accelerate taxable gains or transaction costs and may negatively affect the Portfolios net asset value or performance, which could cause the value
of your investment to decline. Redemption risk is heightened during periods of overall market turmoil.
Foreign Currency
RiskThis is the risk that changes in foreign (non-U.S.) currency exchange rates may negatively affect the value of the Portfolios investments or reduce the returns of the Portfolio. For
example, the value of the Portfolios investments in foreign securities and foreign currency positions may decrease if the U.S. Dollar is strong (i.e., gaining value relative to other currencies) and other currencies are weak
(i.e., losing value relative to the U.S. Dollar).
Actions by a Few Major InvestorsIn certain countries, volatility
may be heightened by actions of a few major investors. For example, substantial increases or decreases in cash flows of mutual funds investing in these markets could significantly affect local securities prices and, therefore, share prices of the
Portfolio.
Market RiskThe Portfolio is subject to market risk, which is the risk that stock or bond prices in general or in
particular countries or sectors may decline over short or extended periods. Stock or bond prices may decline in response to adverse changes in the economy or the economic outlook; deterioration in investor sentiment; interest rate, currency and
commodity price fluctuations; adverse geopolitical, social or environmental developments; issuer- and sector-specific considerations; public health crises (including the occurrence of a contagious disease or illness); policy and legislative changes;
cybersecurity events; and other factors.
Economies and financial markets throughout the world are becoming increasingly interconnected.
Economic, financial or political events, trading and tariff arrangements, sanctions, regional and global conflicts, terrorism, natural disasters (including the spread of infectious illness) and other circumstances in one country or region could have
profound impacts on global economies or markets. As a result, whether or not the Portfolio invest in securities of issuers located in or with significant exposure to countries experiencing economic and financial difficulties, the value and liquidity
of the Portfolios investments may be negatively affected.
| 44 |
Sanford C. Bernstein Fund II, Inc. |
|
Table of Contents
Lower-rated Securities
RiskLower-rated securities, or junk bonds/high-yield securities, are subject to greater risk of loss of principal and interest and greater market risk than higher-rated securities. The capacity of issuers of lower-rated securities to pay
interest and repay principal is more likely to weaken than is that of issuers of higher-rated securities in times of deteriorating economic conditions or rising interest rates.
LIBOR Transition and Associated RiskA Portfolio may be exposed to debt securities, derivatives or other financial instruments
that utilize the London Interbank Offered Rate, or LIBOR, as a benchmark or reference rate for various interest rate calculations. In 2017, the United Kingdom Financial Conduct Authority (FCA), which
regulates LIBOR, announced a desire to phase out the use of LIBOR by the end of 2021. The FCA and LIBORs administrator, ICE Benchmark Administration, have since announced that most LIBOR settings (which reflect LIBOR rates quoted in different
currencies over various time periods) will no longer be published after the end of 2021 but that the most widely used U.S. Dollar LIBOR settings will continue to be published until June 30, 2023. However, banks were strongly encouraged to
cease entering into agreements with counterparties referencing LIBOR by the end of 2021. It is possible that a subset of LIBOR settings will be published after these dates on a synthetic basis, but any such publications would be
considered non-representative of the underlying market. Since 2018 the Federal Reserve Bank of New York has published the secured overnight funding rate (referred to as SOFR), which is intended to replace
U.S. Dollar LIBOR. SOFR is a broad measure of the cost of borrowing cash overnight collateralized by U.S. Treasury securities in the repurchase agreement (repo) market and has been used increasingly on a voluntary basis in new instruments and
transactions. In addition, on March 15, 2022, the Adjustable Interest Rate Act was signed into law. This law provides a statutory fallback mechanism to replace LIBOR with a benchmark rate that is selected by the Federal Reserve Board and based
on SOFR for certain contracts that reference LIBOR without adequate fallback provisions.
The elimination of LIBOR or changes to other
reference rates or any other changes or reforms to the determination or supervision of reference rates could have an adverse impact on the market for, or value of, any securities or payments linked to those reference rates, which may adversely
affect a Portfolios performance and/or net asset value. Uncertainty and risk also remain regarding the willingness and ability of issuers and lenders to include revised provisions in new and existing contracts or instruments. Consequently, the
transition from LIBOR to other reference rates may lead to increased volatility and illiquidity in markets that are tied to LIBOR, fluctuations in values of LIBOR-related investments or investments in issuers that utilize LIBOR, increased difficulty
in borrowing or refinancing and diminished effectiveness of hedging strategies, potentially adversely affecting a Portfolios performance. Furthermore, the risks associated with the expected discontinuation of LIBOR and transition may be
exacerbated if the work necessary to effect an orderly transition to an alternative reference rate is not completed in a timely manner. Neither the effect of the LIBOR transition process nor its ultimate success can yet be known.
Cybersecurity RiskAs the use of the internet and other technologies has become more prevalent in the course of business, the
Portfolios have become more susceptible to operational and financial risks associated with cybersecurity. Cybersecurity incidents can result from deliberate attacks such as gaining unauthorized access to digital systems (e.g., through
hacking or malicious software coding) for purposes of misappropriating assets or sensitive information, corrupting data, or causing operational disruption, or from unintentional events, such as the inadvertent release of confidential
information. Cybersecurity failures or breaches of the Portfolios or their service providers or the issuers of securities in which the Portfolios invest have the ability to cause disruptions and impact business operations, potentially resulting in
financial losses, the inability of Portfolio shareholders to transact business, violations of applicable privacy and other laws, regulatory fines, penalties, reputational damage, reimbursement or other compensation costs, and/or additional
compliance costs. While measures have been developed which are designed to reduce the risks associated with cybersecurity, there is no guarantee that those measures will be effective, particularly since the Portfolios do not control the
cybersecurity defenses or plans of their service providers, financial intermediaries and companies in which they invest or with which they do business.
Cybersecurity incidents, both intentional and unintentional, may allow an unauthorized party to gain access to Portfolio or shareholder
assets, Portfolio or customer data (including private shareholder information), or proprietary information, or cause a Portfolio, the Adviser, and/or the Portfolios service providers (including, but not limited to, fund accountants,
custodians, sub-custodians, transfer agents and financial intermediaries) to suffer data breaches, data corruption or lose operational functionality, or prevent Portfolio investors from purchasing, redeeming
or exchanging shares or receiving distributions. A Portfolio and the Adviser have limited ability to prevent or mitigate cybersecurity incidents affecting
|
2022 Annual Report |
45 | |
Table of Contents
Notes to Financial Statements (continued)
third-party service providers. Cybersecurity incidents may result in financial losses to such Portfolio and its shareholders, and substantial
costs may be incurred in order to prevent any future cybersecurity incidents.
Indemnification RiskIn the ordinary course of
business, the Portfolio enters into contracts that contain a variety of indemnifications. The Portfolios maximum exposure under these arrangements is unknown. However, the Portfolio has not had prior claims or losses pursuant to these
indemnification provisions and expects the risk of loss thereunder to be remote. Therefore, the Portfolio has not accrued any liability in connection with these indemnification provisions.
| NOTE 6. |
Capital-Share Transactions |
Share transactions for the years ended September 30, 2022 and September 30, 2021, were as follows:
| INTERMEDIATE DURATION INSTITUTIONAL PORTFOLIO |
||||||||||||||||||||
| SHARES | AMOUNT | |||||||||||||||||||
| YEAR ENDED 9/30/22 |
YEAR ENDED 9/30/21 |
YEAR ENDED 9/30/22 |
YEAR ENDED 9/30/21 |
|||||||||||||||||
|
Shares sold |
5,662,668 | 16,874,217 | $ | 80,941,080 | $ | 263,341,628 | ||||||||||||||
|
Shares issued to shareholders on reinvestment of dividends and distributions |
1,839,167 | 1,871,569 | 26,986,366 | 29,479,217 | ||||||||||||||||
|
Shares redeemed |
(17,400,799 | ) | (9,590,115 | ) | (251,653,718 | ) | (149,417,820 | ) | ||||||||||||
|
|
|
|
|
|
|
|
|
|||||||||||||
|
Net increase (decrease) |
(9,898,964 | ) | 9,155,671 | $ | (143,726,272 | ) | $ | 143,403,025 | ||||||||||||
|
|
|
|
|
|
|
|
|
|||||||||||||
A number of open-end mutual funds managed by the Adviser, including the Portfolio, participate in a
$325 million revolving credit facility (the Facility) intended to provide short-term financing related to redemptions and other short term liquidity requirements, subject to certain restrictions. Commitment fees related to the
Facility are paid by the participating funds and are included in miscellaneous expenses in the statement of operations. The Portfolio did not utilize the Facility during the year ended September 30, 2022.
| NOTE 8. |
Recent Accounting Pronouncements |
In March 2020, the Financial Accounting Standards Board issued an Accounting Standards Update, ASU
2020-04, Reference Rate Reform (Topic 848)Facilitation of the Effects of Reference Rate Reform on Financial Reporting. ASU 2020-04 provides optional
guidance to ease the potential accounting burden due to the discontinuation of the LIBOR and other interbank-offered based reference rates. ASU 2020-04 is effective as of March 12, 2020 through
December 31, 2022. Management is currently evaluating the impact, if any, of applying ASU 2020-04.
| NOTE 9. |
Subsequent Events |
Management has evaluated subsequent events for possible recognition or disclosure in the financial statements through the date the financial
statements are issued. Management has determined that there are no material events that would require disclosure in the Portfolios financial statements through this date.
| 46 |
Sanford C. Bernstein Fund II, Inc. |
|
Table of Contents
Report of Independent Registered Public Accounting Firm
To the Shareholders and the Board of Directors of Intermediate Duration Institutional
Portfolio
Opinion on the Financial Statements
We have audited the accompanying statement of assets and liabilities of Intermediate Duration Institutional Portfolio (the Portfolio) (the only
series constituting Sanford C. Bernstein Fund II, Inc. (the Fund)), including the schedule of investments, as of September 30, 2022, and the related statement of operations for the year then ended, the statements of changes in net
assets for each of the two years in the period then ended, the financial highlights for each of the five years in the period then ended and the related notes (collectively referred to as the financial statements). In our opinion, the
financial statements present fairly, in all material respects, the financial position of the Portfolio (the only series constituting Sanford C. Bernstein Fund II, Inc.) at September 30, 2022, the results of its operations for the year then
ended, the changes in its net assets for each of the two years in the period then ended and its financial highlights for each of the five years in the period then ended, in conformity with U.S. generally accepted accounting principles.
Basis for Opinion
These financial statements are the
responsibility of the Funds management. Our responsibility is to express an opinion on the Portfolios financial statements based on our audits. We are a public accounting firm registered with the Public Company Accounting Oversight Board
(United States) (PCAOB) and are required to be independent with respect to the Fund in accordance with the U.S. federal securities laws and the applicable rules and regulations of the Securities and Exchange Commission and the PCAOB.
We conducted our audits in accordance with the standards of the PCAOB. Those standards require that we plan and perform the audit to obtain reasonable
assurance about whether the financial statements are free of material misstatement, whether due to error or fraud. The Fund is not required to have, nor were we engaged to perform, an audit of the Funds internal control over financial
reporting. As part of our audits, we are required to obtain an understanding of internal control over financial reporting, but not for the purpose of expressing an opinion on the effectiveness of the Funds internal control over financial
reporting. Accordingly, we express no such opinion.
Our audits included performing procedures to assess the risks of material misstatement of the
financial statements, whether due to error or fraud, and performing procedures that respond to those risks. Such procedures included examining, on a test basis, evidence regarding the amounts and disclosures in the financial statements. Our
procedures included confirmation of securities owned as of September 30, 2022, by correspondence with the custodian, brokers and others; when replies were not received from brokers or others, we performed other auditing procedures. Our audits
also included evaluating the accounting principles used and significant estimates made by management, as well as evaluating the overall presentation of the financial statements. We believe that our audits provide a reasonable basis for our opinion.

We have served as the auditor of one or more of the AB investment companies since 1968.
New York, New York
November 23, 2022
|
2022 Annual Report |
47 | |
Table of Contents
2022 Federal Tax Information (Unaudited)
For
Federal income tax purposes, the following information is furnished with respect to the distributions paid by the Portfolio during the taxable year ended September 30, 2022. For foreign shareholders, 91.40% of ordinary income dividends paid may
be considered to be qualifying to be taxed as interest-related dividends. The Portfolio designates $11,134,244 of dividends paid as long-term capital gain dividends.
Shareholders should not use the above information to prepare their tax returns. The information necessary to complete your income tax returns
will be included with your Form 1099-DIV which will be sent to you separately in January 2023.
| 48 | Sanford C. Bernstein Fund II, Inc. | |
Table of Contents
Sanford C. Bernstein Fund II, Inc.
BOARD OF
DIRECTORS
Marshall C. Turner, Jr.*
Chairman
Jorge A.
Bermudez*
Director
Michael J. Downey*
Director
Onur
Erzan
Chief Executive Officer
Nancy P. Jacklin*
Director
Jeanette W. Loeb*
Director
Carol C.
McMullen*
Director
Garry L. Moody*
Director
OFFICERS
Michael Canter**
Vice President
Janaki Rao**
Vice
President
Emilie D. Wrapp
Secretary
Michael
B. Reyes
Senior Vice President
Joseph J. Mantineo
Treasurer and Chief Financial Officer
Stephen M. Woetzel
Controller
Vincent S. Noto
Chief Compliance Officer
INDEPENDENT REGISTERED
PUBLIC ACCOUNTING FIRM
Ernst & Young LLP
One Manhattan West
New York,
NY 10001
LEGAL COUNSEL
Willkie Farr & Gallagher LLP
787 Seventh Avenue
New York,
NY 10019
CUSTODIAN AND ACCOUNTING AGENT
State Street Bank and Trust Company
State Street Corporation CCB/5
1 Iron Street
Boston, MA
02210
DISTRIBUTOR
Sanford C.
Bernstein & Co, LLC
1345 Avenue of the Americas
New York, NY 10105
TRANSFER AGENT
DST Asset Manager Solutions
2000 Crown Colony Drive
Quincy, MA 02169
INVESTMENT ADVISER
AllianceBernstein L.P.
501 Commerce Street
Nashville, TN 37203
| * | Member of the Audit Committee, the Governance and Nominating Committee, and the Independent Directors Committee. |
| ** | The day-to-day management of, and investment decisions for, Sanford C. Bernstein Fund II, Inc.s portfolio are made by the U.S. Investment Grade: Core Fixed-Income Team. Messrs. Canter and Rao are the investment professionals with the most significant responsibility for the day-to-day management of the Funds portfolio. |
|
2022 Annual Report |
49 | |
Table of Contents
Sanford C. Bernstein Fund II, Inc.
(continued)
|
DIRECTORS |
|
|||||||
|
Name, Address*, Age, (Year First Elected**) |
Principal Occupation(s) During Past Five (5) Years and Other |
Portfolios in Overseen By Director |
Other Public Company Directorships Currently Held By Director |
|||||
|
INTERESTED DIRECTOR |
||||||||
|
Onur Erzan,+ 46 (2021) |
Senior Vice President of AllianceBernstein L.P. (the Adviser), Head of Global Client Group and Head of Private Wealth. He oversees ABs entire private wealth management business and third-party institutional and retail franchise, where he is responsible for all client services, sales and marketing, as well as product strategy, management and development worldwide. Director, President and Chief Executive Officer of the AB Mutual Funds as of April 1, 2021. He is also a member of the Equitable Holdings Management Committee. Prior to joining the firm in 2021, he spent over 19 years with McKinsey, most recently as a senior partner and co-leader of its Wealth & Asset Management practice. In addition, he co-led McKinseys Banking & Securities Solutions (a portfolio of data, analytics and digital assets and capabilities) globally. |
75 | None | |||||
|
DISINTERESTED DIRECTORS |
||||||||
|
Marshall C. Turner, Chairman of the 81 |
Private Investor since prior to 2017. Former Chairman and CEO of Dupont Photomasks, Inc. (semi-conductor manufacturing equipment). He was a Director of Xilinx, Inc. (programmable logic semi-conductors and adaptable, intelligent computing) from 2007 through August 2020, and is a former director of 33 other companies and organizations. He has extensive operating leadership, and venture capital investing experience, including five interim or full-time CEO roles, and prior service as general partner of institutional venture capital partnerships. He also has extensive non-profit board leadership experience, and currently serves on the board of the George Lucas Educational foundation. He has served as a director of one AB Fund since 1992, and director or trustee of all AB Funds since 2005. He has been Chairman of the AB Funds since January 2014, and the Chairman of the Independent Directors Committees of such AB Funds since February 2014. |
75 | None | |||||
| 50 |
Sanford C. Bernstein Fund II, Inc. |
|
Table of Contents
|
DIRECTORS |
|
|||||||
|
Name, Address*, Age, (Year First Elected**) |
Principal Occupation(s) During Past Five (5) Years and Other |
Portfolios in Overseen By Director |
Other Public Company Directorships Currently Held By Director |
|||||
|
Jorge A. 71 |
Private Investor since prior to 2017. Formerly, Chief Risk Officer of Citigroup, Inc., a global financial services company, from November 2007 to March 2008, Chief Executive Officer of Citigroups Commercial Business Group in North America and Citibank Texas from 2005 to 2007, and a variety of other executive and leadership roles at various businesses within Citigroup prior to then; Chairman (2018) of the Texas A&M Foundation Board of Trustees (Trustee since 2013) and Chairman of the Smart Grid Center Board at Texas A&M University since 2012; director of, among others, Citibank N.A. from 2005 to 2008, the Federal Reserve Bank of Dallas, Houston Branch from 2009 to 2011, the Federal Reserve Bank of Dallas from 2011 to 2017, and the Electric Reliability Council of Texas from 2010 to 2016. He has served as director or trustee of the AB Funds since January 2020. |
75 | Moodys Corporation since April 2011 | |||||
|
Michael J. 78 (2005) |
Private Investor since prior to 2017. Formerly, Chairman of The Asia Pacific Fund, Inc. (registered investment company) since prior to 2017 until January 2019. From 1987 until 1993, Chairman and CEO of Prudential Mutual Fund Management, director of the Prudential mutual funds, and member of the Executive Committee of Prudential Securities, Inc. He has served as a director or trustee of the AB Funds since 2005. |
75 | None | |||||
|
2022 Annual Report |
51 | |
Table of Contents
Sanford C. Bernstein Fund II, Inc.
(continued)
|
DIRECTORS |
|
|||||||
|
Name, Address*, Age, (Year First Elected**) |
Principal Occupation(s) During Past Five (5) Years and Other |
Portfolios in Overseen By Director |
Other Public Company Directorships Currently Held By Director |
|||||
|
Nancy P. 74 |
Private Investor since prior to 2017. Professorial Lecturer at the Johns Hopkins School of Advanced International Studies (2008-2015). U.S. Executive Director of the International Monetary Fund (which is responsible for ensuring the stability of the international monetary system), (December 2002-May 2006); Partner, Clifford Chance (1992-2002); Sector Counsel, International Banking and Finance, and Associate General Counsel, Citicorp (1985-1992); Assistant General Counsel (International), Federal Reserve Board of Governors (1982-1985); and Attorney Advisor, U.S. Department of the Treasury (1973-1982). Member of the Bar of the District of Columbia and of New York; and member of the Council on Foreign Relations. She has served as a director or trustee of the AB Funds since 2006 and has been Chair of the Governance and Nominating Committees of the AB Funds since August 2014. |
75 | None | |||||
|
Jeanette W. 70 (2020) |
Chief Executive Officer of PetCareRx (e-commerce pet pharmacy) from 2002 to 2011 and 2015 to present. Director of New York City Center since 2005. She was a director of AB Multi-Manager Alternative Fund, Inc. (fund of hedge funds) from 2012 to 2018. Formerly, affiliated with Goldman Sachs Group, Inc. (financial services) from 1977 to 1994, including as a partner thereof from 1986 to 1994. She has served as director or trustee of the AB Funds since April 2020. |
75 | Apollo Investment Corp. (business development company) since August 2011 | |||||
| 52 |
Sanford C. Bernstein Fund II, Inc. |
|
Table of Contents
|
DIRECTORS |
|
|||||||
|
Name, Address*, Age, (Year First Elected**) |
Principal Occupation(s) During Past Five (5) Years and Other |
Portfolios in AB Fund Overseen By Director |
Other Public Company Held By Director |
|||||
|
Carol C. 67 |
Managing Director of Slalom Consulting (consulting) since 2014, private investor and a member of the Advisory Board of Butcher Box (since 2018). Formerly, member, Partners Healthcare Investment Committee (2010-2019); Director of Norfolk & Dedham Group (mutual property and casualty insurance) from 2011 until November 2016; Director of Partners Community Physicians Organization (healthcare) from 2014 until December 2016; and Managing Director of The Crossland Group (consulting) from 2012 until 2013. She has held a number of senior positions in the asset and wealth management industries, including at Eastern Bank (where her roles included President of Eastern Wealth Management), Thomson Financial (Global Head of Sales for Investment Management), and Putnam Investments (where her roles included Chief Investment Officer, Core and Growth and Head of Global Investment Research). She has served on a number of private company and non-profit boards, and as a director or trustee of the AB Funds since June 2016. |
75 | None | |||||
|
2022 Annual Report |
53 | |
Table of Contents
Sanford C. Bernstein Fund II, Inc.
(continued)
|
DIRECTORS |
|
|||||||
|
Name, Address*, Age, (Year First Elected**) |
Principal Occupation(s) During Past Five (5) Years and Other |
Portfolios in AB Fund Overseen By Director |
Other Public Company Held By Director |
|||||
|
Garry L. 70 (2008) |
Private Investor since prior to 2017. Formerly, Partner Deloitte & Touche LLP (1995-2008) where he held a number of senior positions, including Vice Chairman, and U.S. and Global Investment Management Practice Managing Partner; President, Fidelity Accounting and Custody Services Company (1993-1995), where he was responsible for accounting, pricing, custody and reporting for the Fidelity mutual funds; and Partner, Ernst & Young LLP (1975-1993), where he served as the National Director of Mutual Fund Tax Services and Managing Partner of its Chicago Office Tax department. He is a member of the Investment Company Institutes Board of Governors and the Independent Directors Councils Governing Council, where he serves as Chairman of its Governance Committee. He has served as a director or trustee, and as Chairman of the Audit Committees of the AB Funds since 2008. |
75 | None | |||||
* The address for each of the Funds disinterested Directors is c/o AllianceBernstein L.P., Attention: Legal and Compliance DepartmentMutual Fund
Legal, 1345 Avenue of the Americas, New York, NY 10105.
** There is no stated term of office for the Funds Directors.
*** The information above includes each Directors principal occupation during the last five years and other information relating to the experience,
attributes, and skills relevant to each Directors qualifications to serve as a Director, which led to the conclusion that each Director should serve as a Director for the Fund.
Member of the Audit Committee, the Governance and Nominating Committee, and the Independent Directors Committee.
+ Mr. Erzan is an interested person, of the Fund, as defined in the Investment Company Act of 1940, due to his position as a Senior Vice President
of the Adviser.
| 54 |
Sanford C. Bernstein Fund II, Inc. |
|
Table of Contents
|
OFFICERS |
||||
| Name, Address* and Age |
Principal Position(s) Held with Fund |
Principal Occupation During Past Five (5) Years |
||
|
Onur Erzan 46 |
President and Chief Executive Officer | See biography above. | ||
|
Michael Canter 53 |
Vice President | Senior Vice President of the Adviser, with which he has been associated since prior to 2017. He is also Director and Chief Investment OfficerSecuritized Assets. |
||
|
Janaki Rao 52 |
Vice President | Senior Vice President of the Adviser, with which he has been associated since prior to 2017. He is also Director of US Multi-Sector Fixed-Income Portfolios. |
||
|
Emilie D. Wrapp 66 |
Secretary | Senior Vice President, Assistant General Counsel and Assistant Secretary of AllianceBernstein Investments, Inc. (ABI), with which she has been associated since prior to 2017. |
||
|
Michael B. Reyes 46 |
Senior Vice President | Vice President of the Adviser, with which he has been associated since prior to 2017. | ||
|
Joseph J. Mantineo 63 |
Treasurer and Chief Financial Officer | Senior Vice President of AllianceBernstein Investor Services, Inc. (ABIS), with which he has been associated since prior to 2017. |
||
|
Stephen M. Woetzel 51 |
Controller | Senior Vice President of ABIS, with which he has been associated since prior to 2017. | ||
|
Vincent S. Noto 57 |
Chief Compliance Officer | Senior Vice President and Mutual Fund Chief Compliance Officer of the Adviser, since prior to 2017. | ||
* The address for the Funds Officers is 1345 Avenue of the Americas, New York, NY 10105.
The Adviser, ABI and ABIS are affiliates of the Fund.
The
Funds Statement of Additional Information (SAI) has additional information about the Funds Directors and Officers and is available without charge upon request. Contact your financial representative or AB at (800) 227-4618, or
visit www.abfunds.com, for a free prospectus or SAI.
|
2022 Annual Report |
55 | |
Table of Contents
Operation and
Effectiveness of the Portfolios Liquidity Risk Management Program:
In October 2016, the Securities and Exchange Commission
(SEC) adopted the open-end fund liquidity rule (the Liquidity Rule). In June 2018 the SEC adopted a requirement that funds disclose information about the operation and effectiveness of
their Liquidity Risk Management Program (LRMP) in their reports to shareholders.
One of the requirements of the Liquidity
Rule is for the Portfolio to designate an Administrator of the Portfolios Liquidity Risk Management Program. The Administrator of the Portfolios LRMP is AllianceBernstein L.P., the Portfolios investment adviser (the
Adviser). The Adviser has delegated the responsibility to its Liquidity Risk Management Committee (the Committee).
Another requirement of the Liquidity Rule is for the Portfolios Board of Directors (the Fund Board) to receive an annual
written report from the Administrator of the LRMP, which addresses the operation of the Portfolios LRMP and assesses its adequacy and effectiveness. The Adviser provided the Fund Board with such annual report during the first quarter of 2022,
which covered the period January 1, 2021 through December 31, 2021 (the Program Reporting Period).
The LRMPs
principal objectives include supporting the Portfolios compliance with limits on investments in illiquid assets and mitigating the risk that the Portfolio will be unable to meet its redemption obligations in a timely manner.
Pursuant to the LRMP, the Portfolio classifies the liquidity of its portfolio investments into one of the four categories defined by the SEC:
Highly Liquid, Moderately Liquid, Less Liquid, and Illiquid. These classifications are reported to the SEC on Form N-PORT.
During the Program Reporting Period, the Committee reviewed whether the Portfolios strategy is appropriate for an open-end structure, incorporating any holdings of less liquid and illiquid assets. If the Portfolio participated in derivative transactions, the exposure from such transactions were considered in the LRMP.
The Committee also performed an analysis to determine whether the Portfolio is required to maintain a Highly Liquid Investment Minimum
(HLIM). The Committee also incorporated the following information when determining the Portfolios reasonably anticipated trading size for purposes of liquidity monitoring: historical net redemption activity, a Portfolios
concentration in an issuer, shareholder concentration, investment performance, total net assets, and distribution channels.
The Adviser
informed the Fund Board that the Committee believes the Portfolios LRMP is adequately designed, has been implemented as intended, and has operated effectively since its inception. No material exceptions have been noted since the implementation
of the LRMP. During the Program Reporting Period, liquidity in all markets was significantly recovered and improved compared to the prior reporting period which included extreme levels of price volatility and relative illiquidity beginning in March
2020 with COVID-19 impacts. As such, the program operated in a relatively robust and benign liquidity environment experienced in markets during the Program Reporting Period. There were no liquidity events that
impacted the Portfolio or its ability to timely meet redemptions during the Program Reporting Period.
| 56 |
Sanford C. Bernstein Fund II, Inc. |
|
Table of Contents
Information
Regarding the Review and Approval of the Funds Advisory Agreement
The disinterested directors (the directors)
of Sanford C. Bernstein II, Inc. (the Company) unanimously approved the continuance of the Companys Advisory Agreement with the Adviser in respect of Bernstein Intermediate Duration Institutional Portfolio (the Fund) at
a meeting held by video conference on November 2-4, 2021 (the Meeting).
Prior to
approval of the continuance of the Advisory Agreement, the directors had requested from the Adviser, and received and evaluated, extensive materials. They reviewed the proposed continuance of the Advisory Agreement with the Adviser and with
experienced counsel who are independent of the Adviser, who advised on the relevant legal standards. The directors also reviewed additional materials, including comparative analytical data prepared by the Senior Analyst for the Fund. The directors
also discussed the proposed continuance in private sessions with counsel.
The directors considered their knowledge of the nature and
quality of the services provided by the Adviser to the Fund gained from their experience as directors or trustees of most of the registered investment companies advised by the Adviser, their overall confidence in the Advisers integrity and
competence they have gained from that experience, the Advisers initiative in identifying and raising potential issues with the directors and its responsiveness, frankness and attention to concerns raised by the directors in the past, including
the Advisers willingness to consider and implement organizational and operational changes designed to improve investment results and the services provided to the AB Funds. The directors noted that they have four regular meetings each year, at
each of which they review extensive materials and information from the Adviser, including information on the investment performance of the Fund and the money market fund advised by the Adviser in which the Fund invests a portion of its assets.
The directors also considered all factors they believed relevant, including the specific matters discussed below. During the course of their
deliberations, the directors evaluated, among other things, the reasonableness of the advisory fee. The directors did not identify any particular information that was all-important or controlling, and
different directors may have attributed different weights to the various factors. The directors determined that the selection of the Adviser to manage the Fund and the overall arrangements between the Fund and the Adviser, as provided in the
Advisory Agreement, including the advisory fee, were fair and reasonable in light of the services performed, expenses incurred and such other matters as the directors considered relevant in the exercise of their business judgment. The material
factors and conclusions that formed the basis for the directors determinations included the following:
Nature, Extent and
Quality of Services Provided
The directors considered the scope and quality of services provided by the Adviser under the
Advisory Agreement, including the quality of the investment research capabilities of the Adviser and the other resources it has dedicated to performing services for the Fund. The directors noted that the Adviser from time to time reviews the
Funds investment strategies and from time to time proposes changes intended to improve the Funds relative or absolute performance for the directors consideration. They also noted the professional experience and qualifications of
the Funds portfolio management team and other senior personnel of the Adviser. The directors also considered that the Advisory Agreement provides that the Fund will reimburse the Adviser for the cost to it of providing certain clerical,
accounting, administrative and other services to the Fund by employees of the Adviser or its affiliates. Requests for these reimbursements are made on a quarterly basis and subject to approval by the directors. Reimbursements, to the extent
requested and paid, result in a higher rate of total compensation from the Fund to the Adviser than the fee rate stated in the Advisory Agreement. The directors noted that the methodology used to determine the reimbursement amounts had been reviewed
by an independent consultant at the request of the directors. The quality of administrative and other services, including the Advisers role in coordinating the activities of the Funds other service providers, also was considered. The
directors concluded that, overall, they were satisfied with the nature, extent and quality of services provided to the Fund under the Advisory Agreement.
Costs of Services Provided and Profitability
The directors reviewed a schedule of the revenues and expenses and related notes indicating the profitability of the Fund to the Adviser for
calendar years 2019 and 2020 that had been prepared with an expense allocation methodology arrived at in consultation with an independent consultant at the request of the directors. The directors noted the assumptions and methods of allocation used
by the Adviser in preparing fund-specific profitability data and understood that there are a number of potentially acceptable allocation methodologies for information of this type. The directors noted that the
|
2022 Annual Report |
57 | |
Table of Contents
profitability information reflected all revenues and expenses of the Advisers relationship with the Fund. The directors recognized that it is difficult to make comparisons of the
profitability of the Advisory Agreement with the profitability of fund advisory contracts for unaffiliated funds because comparative information is not generally publicly available and is affected by numerous factors. The directors focused on the
profitability of the Advisers relationship with the Fund before taxes and distribution expenses. The directors concluded that the Advisers level of profitability from its relationship with the Fund was not unreasonable.
Fall-Out Benefits
The directors considered the other benefits to the Adviser and its affiliates from their relationships with the Fund and the money market fund
advised by the Adviser in which the Fund invests. The directors noted that shares of the Fund are distributed exclusively through a subsidiary of the Adviser, and that such subsidiary receives fees from its clients in connection with its services.
The directors recognized that the Advisers profitability would be somewhat lower without these benefits. The directors understood that the Adviser also might derive reputational and other benefits from its association with the Fund.
Investment Results
In addition to the information reviewed by the directors in connection with the Meeting, the directors receive detailed performance
information for the Fund at each regular Board meeting during the year.
At the Meeting, the directors reviewed performance information
prepared by an independent service provider (the 15(c) service provider), showing the performance of the Fund against a group of similar funds (peer group) and a larger group of similar funds (peer universe), each
selected by the 15(c) service provider, and information prepared by the Adviser showing the Funds performance against a broad-based securities market index, in each case for the 1-, 3-, 5- and 10-year periods ended July 31, 2021 and (in the case of comparisons with the broad-based securities market index) for
the period from inception. Based on their review, the directors concluded that the Funds investment performance was acceptable.
Advisory Fees and Other Expenses
The directors considered the advisory fee rate payable by the Fund to the Adviser and information prepared by the 15(c) service provider
concerning advisory fee rates payable by other funds in the same category as the Fund. The directors recognized that it is difficult to make comparisons of advisory fees because there are variations in the services that are included in the fees
payable by other funds. The directors compared the Funds contractual effective advisory fee rate with a peer group median and noted that it was above the median. The directors also took into account the impact on the advisory fee rate of the
administrative expense reimbursement paid to the Adviser in the latest fiscal year.
The directors also considered the Advisers fee
schedule for other clients utilizing investment strategies similar to those of the Fund. For this purpose, they reviewed the relevant advisory fee information from the Advisers Form ADV and in a report from the Funds Senior Analyst
and noted the differences between the Funds fee schedule, on the one hand, and the Advisers institutional fee schedule and the schedule of fees charged by the Adviser to any offshore funds and for services to any sub-advised funds utilizing investment strategies similar to those of the Fund, on the other. The directors noted that the Adviser may, in some cases, agree to fee rates with large institutional clients that are
lower than those reviewed by the directors and that they had previously discussed with the Adviser its policies in respect of such arrangements. The directors also compared the advisory fee rate for the Fund with that for another fund advised by the
Adviser utilizing similar investment strategies.
The Adviser reviewed with the directors the significantly greater scope of the services
it provides to the Fund relative to institutional, offshore fund and sub-advised fund clients. In this regard, the Adviser noted, among other things, that, compared to institutional and offshore or sub-advisory accounts, the Fund (i) demands considerably more portfolio management, research and trading resources due to significantly higher daily cash flows; (ii) has more tax and regulatory
restrictions and compliance obligations; (iii) must prepare and file or distribute regulatory and other communications about fund operations; and (iv) must provide shareholder servicing to retail investors. The Adviser also reviewed the
greater legal risks presented by the large and changing population of Fund shareholders who may assert claims against the Adviser in individual or class actions, and the greater entrepreneurial risk in offering new fund products, which require
| 58 |
Sanford C. Bernstein Fund II, Inc. |
|
Table of Contents
substantial investment to
launch, may not succeed, and generally must be priced to compete with larger, more established funds resulting in lack of profitability to the Adviser until a new fund achieves scale. In light of the substantial differences in services rendered by
the Adviser to institutional, offshore fund and sub-advised fund clients as compared to the Fund, and the different risk profile, the directors considered these fee comparisons inapt and did not place
significant weight on them in their deliberations.
In connection with their review of the Funds advisory fee, the directors also
considered the total expense ratio of the Fund in comparison to a peer group and a peer universe selected by the 15(c) service provider. The expense ratio of the Fund was based on the Funds latest fiscal year and the directors considered the
Advisers expense cap for the Fund. The directors noted that it was likely that the expense ratios of some of the other funds in the Funds category were lowered by waivers or reimbursements by those funds investment advisers, which
in some cases might be voluntary or temporary. The directors view expense ratio information as relevant to their evaluation of the Advisers services because the Adviser is responsible for coordinating services provided to the Fund by others.
Based on their review, the directors concluded that the Funds expense ratio was acceptable.
Economies of Scale
The directors noted that the advisory fee schedule for the Fund contains breakpoints that reduce the Funds fee rate on assets above
specified levels. The directors took into consideration prior presentations by an independent consultant on economies of scale in the mutual fund industry and for the AB Funds, and presentations from time to time by the Adviser concerning certain of
its views on economies of scale. The directors also had requested and received from the Adviser certain updates on economies of scale in advance of the Meeting. The directors believe that economies of scale may be realized (if at all) by the Adviser
across a variety of products and services, and not only in respect of a single fund. The directors noted that there is no established methodology for setting breakpoints that give effect to the fund-specific services provided by a funds
adviser and to the economies of scale that an adviser may realize in its overall mutual fund business or those components of it which directly or indirectly affect a funds operations. The directors observed that in the mutual fund industry as
a whole, as well as among funds similar to the Fund, there is no uniformity or pattern in the fees and asset levels at which breakpoints (if any) apply. The directors also noted that the advisory agreements for many funds do not have breakpoints at
all. Having taken these factors into account, the directors concluded that the Funds shareholders would benefit from a sharing of economies of scale in the event the Funds net assets exceed a breakpoint in the future.
|
2022 Annual Report |
59 | |
Table of Contents

Distributor
SANFORD C. BERNSTEIN FUND II, INC.
1345 AVENUE OF THE AMERICAS, NEW YORK, NY 10105
(212) 756-4097
SCBII-2038-0922
Table of Contents
ITEM 2. CODE OF ETHICS.
(a) The registrant has adopted a code of ethics that applies to its principal executive officer, principal financial officer and principal accounting officer.
A copy of the registrants code of ethics is filed herewith as Exhibit 12(a)(1).
(b) During the period covered by this report, no material amendments
were made to the provisions of the code of ethics adopted in 2(a) above.
(c) During the period covered by this report, no implicit or explicit waivers to
the provisions of the code of ethics adopted in 2(a) above were granted.
ITEM 3. AUDIT COMMITTEE FINANCIAL EXPERT.
The registrants Board of Directors has determined that independent directors Garry L. Moody, Marshall C. Turner, Jr. and Jorge A. Bermudez qualify as
audit committee financial experts.
ITEM 4. PRINCIPAL ACCOUNTANT FEES AND SERVICES.
(a) – (c) The following table sets forth the aggregate fees billed by the independent registered public accounting firm Ernst & Young LLP, for the
Funds last two fiscal years, for professional services rendered for: (i) the audit of the Funds annual financial statements included in the Funds annual report to stockholders; (ii) assurance and related services that are
reasonably related to the performance of the audit of the Funds financial statements and are not reported under (i), which include advice and education related to accounting and auditing issues, quarterly press release review (for those Funds
that issue quarterly press releases), and preferred stock maintenance testing (for those Funds that issue preferred stock); and (iii) tax compliance, tax advice and tax return preparation.
| Audit Fees | Audit-Related Fees |
Tax Fees | ||||||||||||||
|
Bernstein Intermediate Duration Institutional Portfolio |
2021 | $ | 92,510 | $ | | $ | 30,110 | |||||||||
| 2022 | $ | 97,136 | $ | | $ | 18,939 | ||||||||||
(d) Not applicable.
(e) (1) Beginning with audit and non-audit service contracts entered into on or after May 6, 2003, the
Funds Audit Committee policies and procedures require the pre-approval of all audit and non-audit services provided to the Fund by the Funds independent
registered public accounting firm. The Funds Audit Committee policies and procedures also require pre-approval of all audit and non-audit services provided to the
Adviser and Service Affiliates to the extent that these services are directly related to the operations or financial reporting of the Fund.
(e) (2)
All of the amounts for Audit Fees, Audit-Related Fees and Tax Fees in the table under Item 4 (a)(c) are for services pre-approved by the Funds Audit Committee.
Table of Contents
(f) Not applicable.
(g) The following table sets forth the aggregate non-audit services provided to the Fund, the Funds Adviser and
entities that control, are controlled by or under common control with the Adviser that provide ongoing services to the Fund:
| All Fees for Non-Audit Services Provided to the Portfolio, the Adviser and Service Affiliates |
Total Amount of Foregoing Column Pre- approved by the Audit Committee (Portion Comprised of Audit Related Fees) (Portion Comprised of Tax Fees) |
|||||||||||
|
Bernstein Intermediate Duration Institutional Portfolio |
2021 | $ | 1,105,250 | $ | 30,110 | |||||||
| $ | | |||||||||||
| $ | (30,110 | ) | ||||||||||
| 2022 | $ | 1,951,397 | $ | 18,939 | ||||||||
| $ | | |||||||||||
| $ | (18,939 | ) | ||||||||||
(h) The Audit Committee of the Fund has considered whether the provision of any
non-audit services not pre-approved by the Audit Committee provided by the Funds independent registered public accounting firm to the Adviser and Service
Affiliates is compatible with maintaining the auditors independence.
ITEM 5. AUDIT COMMITTEE OF LISTED REGISTRANTS.
Not applicable to the registrant.
ITEM 6. INVESTMENTS.
Please see Schedule of Investments contained in the Report to Shareholders included under Item 1 of this Form
N-CSR.
ITEM 7. DISCLOSURE OF PROXY VOTING POLICIES AND PROCEDURES FOR
CLOSED-END MANAGEMENT INVESTMENT COMPANIES.
Not applicable to the registrant.
Table of Contents
ITEM 8. PORTFOLIO MANAGERS OF CLOSED-END MANAGEMENT INVESTMENT
COMPANIES.
Not applicable to the registrant.
ITEM 9. PURCHASES OF EQUITY SECURITIES BY CLOSED-END MANAGEMENT INVESTMENT COMPANY AND AFFILIATED PURCHASERS.
Not applicable to the registrant.
ITEM 10.
SUBMISSION OF MATTERS TO A VOTE OF SECURITY HOLDERS.
There have been no material changes to the procedures by which shareholders may recommend
nominees to the Funds Board of Directors since the Fund last provided disclosure in response to this item.
ITEM 11. CONTROLS AND PROCEDURES.
(a) The registrants principal executive officer and principal financial officer have concluded that the registrants disclosure controls
and procedures (as defined in Rule 30a-2(c) under the Investment Company Act of 1940, as amended) are effective at the reasonable assurance level based on their evaluation of these controls and procedures as
of a date within 90 days of the filing date of this document.
(b) There were no changes in the registrants internal controls over financial
reporting that occurred during the period that has materially affected, or is reasonably likely to materially affect, the registrants internal control over financial reporting.
Table of Contents
ITEM 12. DISCLOSURE OF SECURITIES LENDING ACTIVITIES FOR
CLOSED-END MANAGEMENT INVESTMENT COMPANIES.
Not applicable to the registrant.
ITEM 13. EXHIBITS.
The following exhibits are
attached to this Form N-CSR:
Table of Contents
SIGNATURES
Pursuant to the requirements of the Securities Exchange Act of 1934 and the Investment Company Act of 1940, the registrant has duly caused this report to be
signed on its behalf by the undersigned, thereunto duly authorized.
(Registrant): Sanford C. Bernstein Fund II, Inc.
| By: |
/s/ Onur Erzan |
|
| Onur Erzan | ||
| President |
Date: November 29, 2022
Pursuant to the requirements of the Securities Exchange Act of 1934 and the Investment Company Act of 1940, this report has been signed below by the following
persons on behalf of the registrant and in the capacities and on the dates indicated.
| By: |
/s/ Onur Erzan |
|
| Onur Erzan | ||
| President |
Date: November 29, 2022
| By: |
/s/ Joseph J. Mantineo |
|
| Joseph J. Mantineo | ||
| Treasurer and Chief Financial Officer |
Date: November 29, 2022
ATTACHMENTS / EXHIBITS


